Splunk: Basics
Learn the basics of Splunk, a powerful SIEM tool used for log analysis and threat detection. Explore its core features and functionality through the TryHackMe Splunk 101 room.
Splunk Components
Splunk is one of the leading SIEM solutions in the market that provides the ability to collect, analyze and correlate the network and machine logs in real-time.
Splunk has three main components, namely Forwarder, Indexer, and Search Head. These components are explained below:
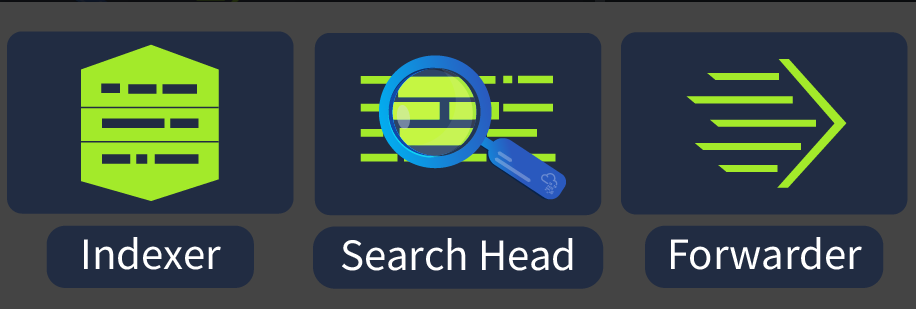
Splunk Forwarder
Splunk Forwarder is a lightweight agent installed on the endpoint intended to be monitored, and its main task is to collect the data and send it to the Splunk instance. It does not affect the endpoint’s performance as it takes very few resources to process. Some of the key data sources are:
- Web server generating web traffic
- Windows machine generating Windows Event Logs, PowerShell, and Sysmon data
- Linux host generating host-centric logs
- Database generating DB connection requests, responses, and errors
Splunk Indexer
Splunk Indexer plays the main role in processing the data it receives from forwarders. It takes the data, normalizes it into field-value pairs, determines the datatype of the data, and stores them as events. Processed data is easy to search and analyze.
Search Head
Splunk Search Head is the place within the Search & Reporting App where users can search the indexed logs. When a user searches for a term or uses a search language known as Splunk Search Processing Language (SPL), the request is sent to the indexer, and the relevant events are returned in the form of field-value pairs.
The Search Head also provides the ability to transform results into presentable tables and visualizations, such as:
- Pie charts
- Bar charts
- Column charts
Navigating Splunk
Splunk Bar
When you access Splunk, you will see the default home screen.
At the top is the Splunk Bar, which includes several useful features:
- Messages – View system-level messages
- Settings – Configure the Splunk instance
- Activity – Track the progress of background jobs
- Help – Access tutorials and documentation
- Find – Search across Splunk features

You can also switch between installed Splunk apps from the Splunk Bar without using the Apps Panel.

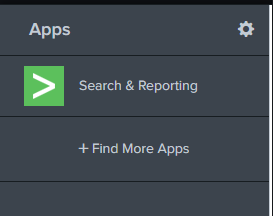
Apps Panel
The Apps Panel displays all the apps installed on the Splunk instance.
- The default app for every Splunk installation is Search & Reporting
This panel helps users easily navigate between different Splunk apps.
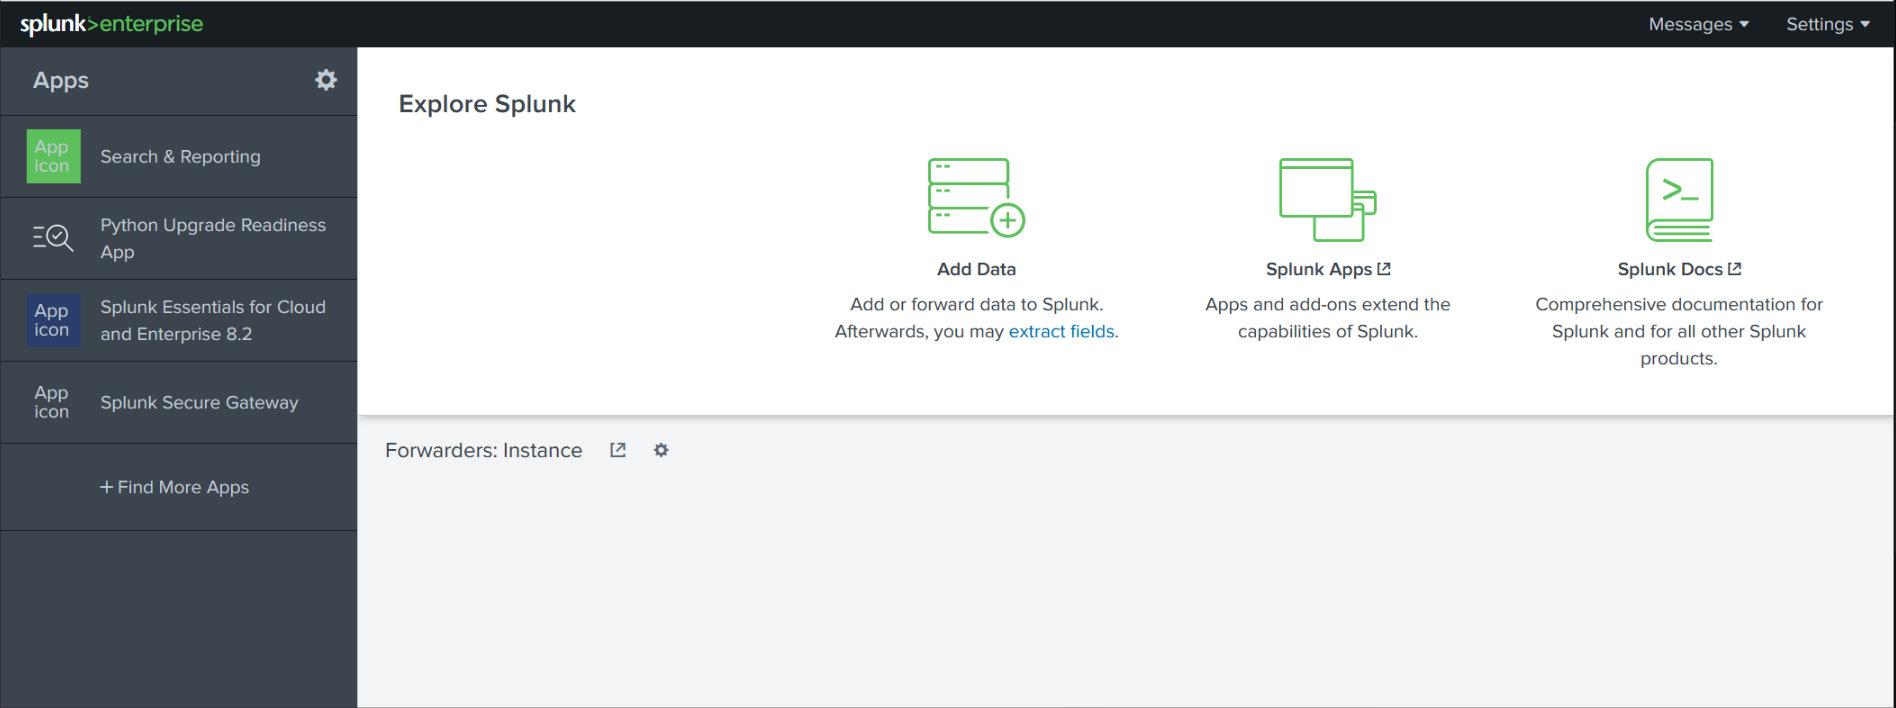
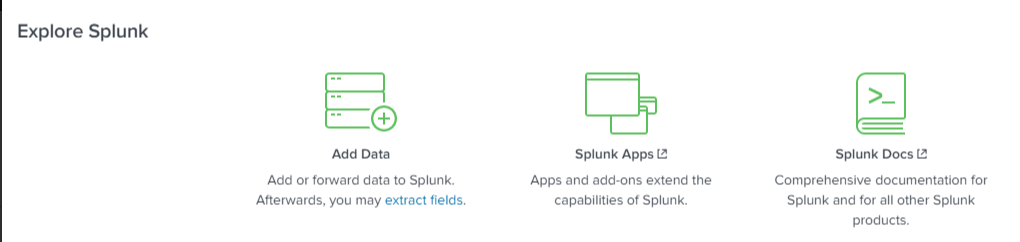
Explore Splunk
The Explore Splunk section provides quick-access links for:
- Adding data to Splunk
- Installing new Splunk apps
- Viewing Splunk documentation
This panel is helpful for getting started quickly with core features.
Splunk Dashboard
The Home Dashboard section allows you to view or manage dashboards.
- By default, no dashboards are shown
- You can select dashboards from a dropdown menu or visit the dashboards listing page
- You can create custom dashboards and add them to the Home Dashboard
- To view only your dashboards, click the Yours tab
For more details, refer to the official Splunk documentation on Navigating Splunk.
Adding Data
Splunk can ingest any kind of data. According to the official Splunk documentation, once data is added to Splunk, it is processed and transformed into a series of individual events.
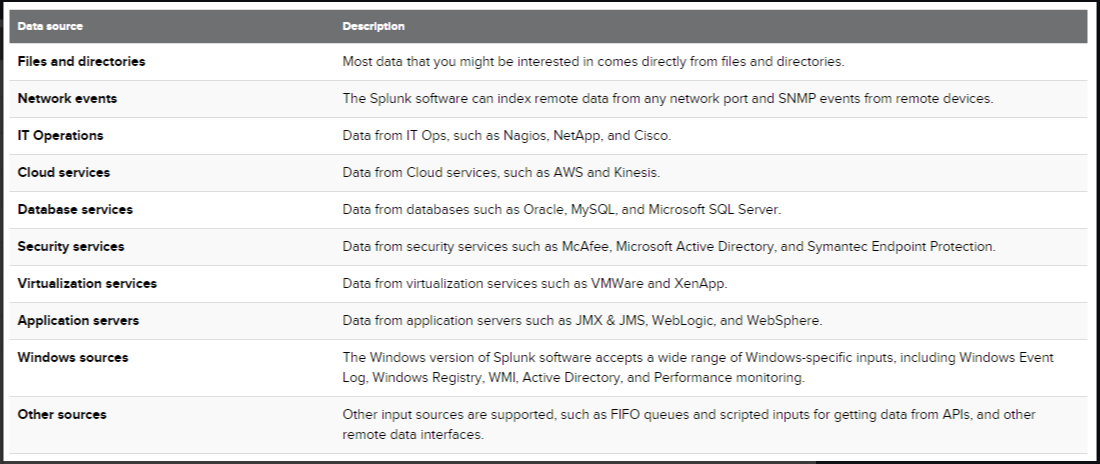
Common data sources include:
- Event logs
- Website logs
- Firewall logs
- VPN logs
- And many more…
These data sources are grouped into categories, as detailed in the Splunk documentation.
Focus: VPN Logs
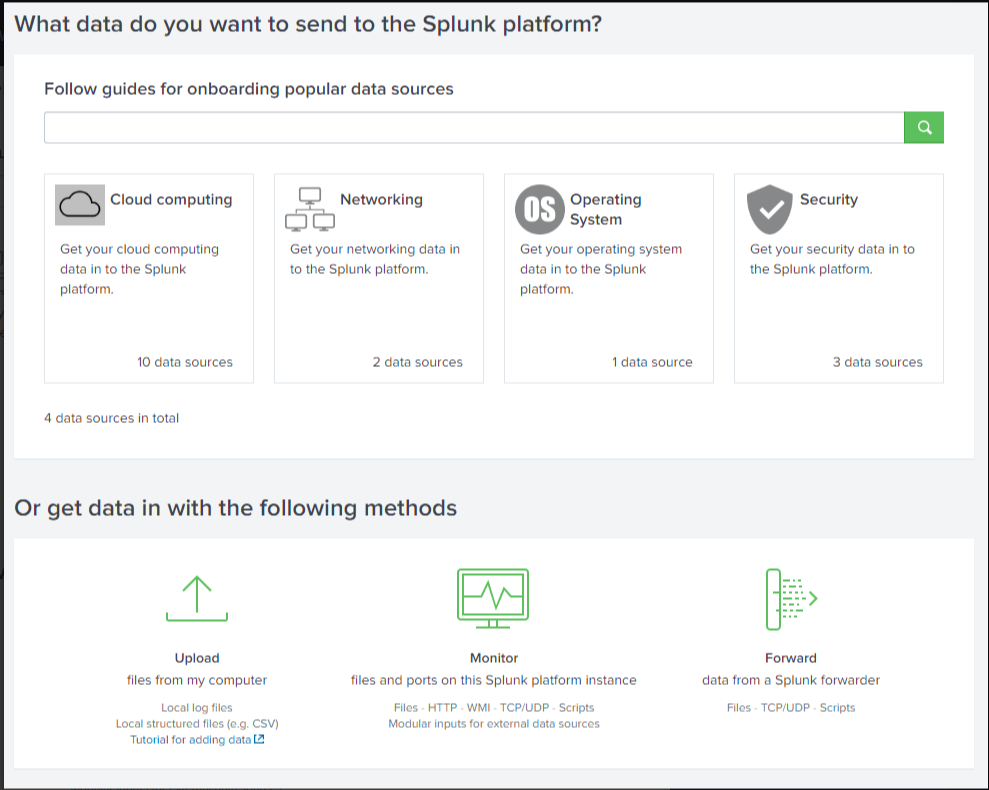
In this room, we will focus on ingesting VPN logs.
From the Splunk home screen:
- Click on the Add Data link
- You will be taken to the Data Sources screen
- Select the Upload option to upload data from your local machine
💡 Tip: If you’re using the AttackBox, the sample log file
VPN_logsis located at:
/root/Rooms/SplunkBasic/
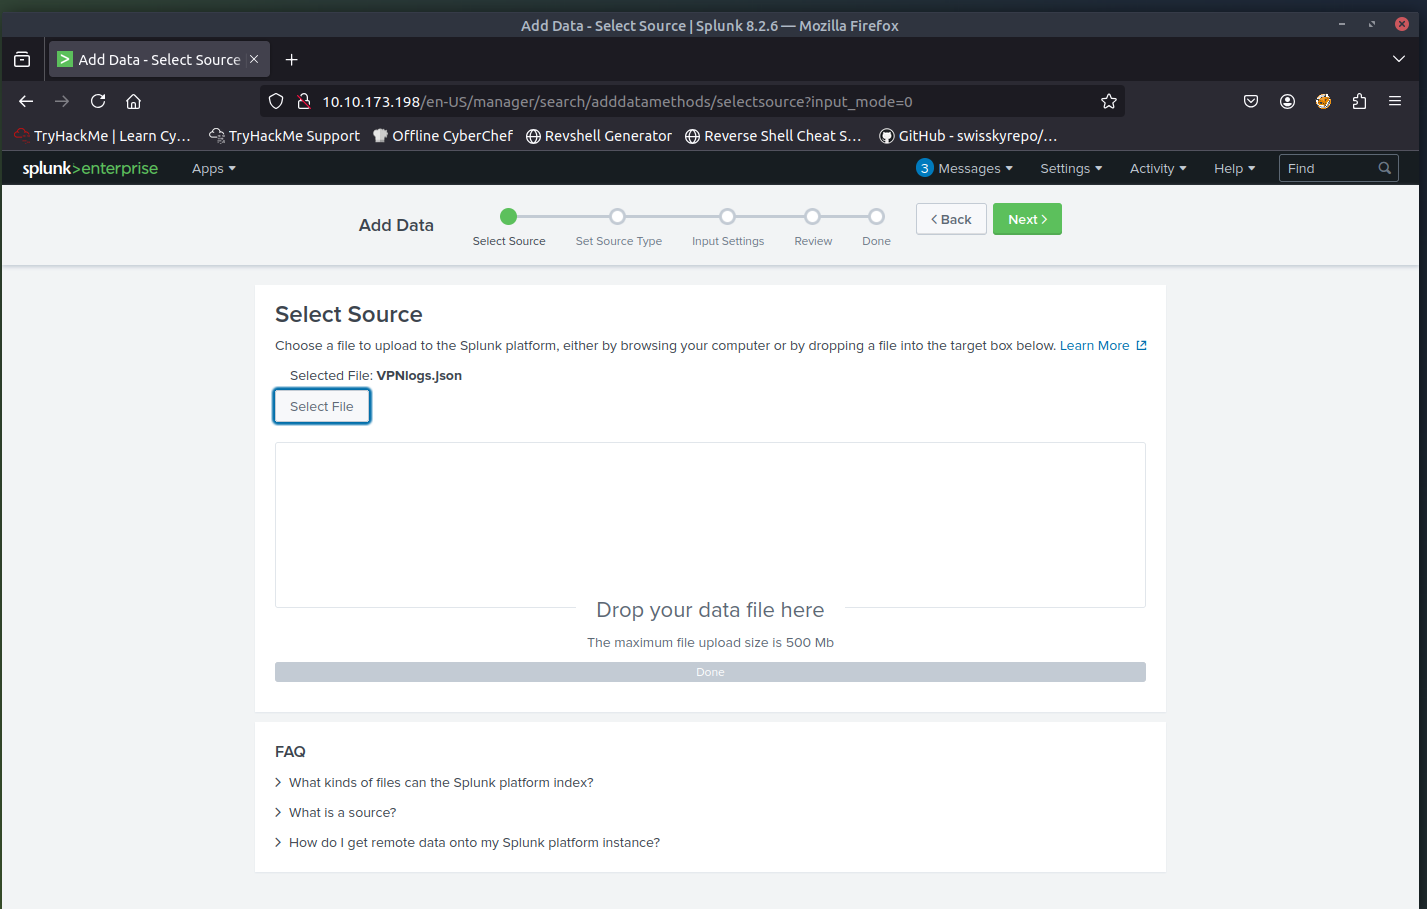
Uploading Data to Splunk: 5 Steps
Splunk breaks down data ingestion into five steps:
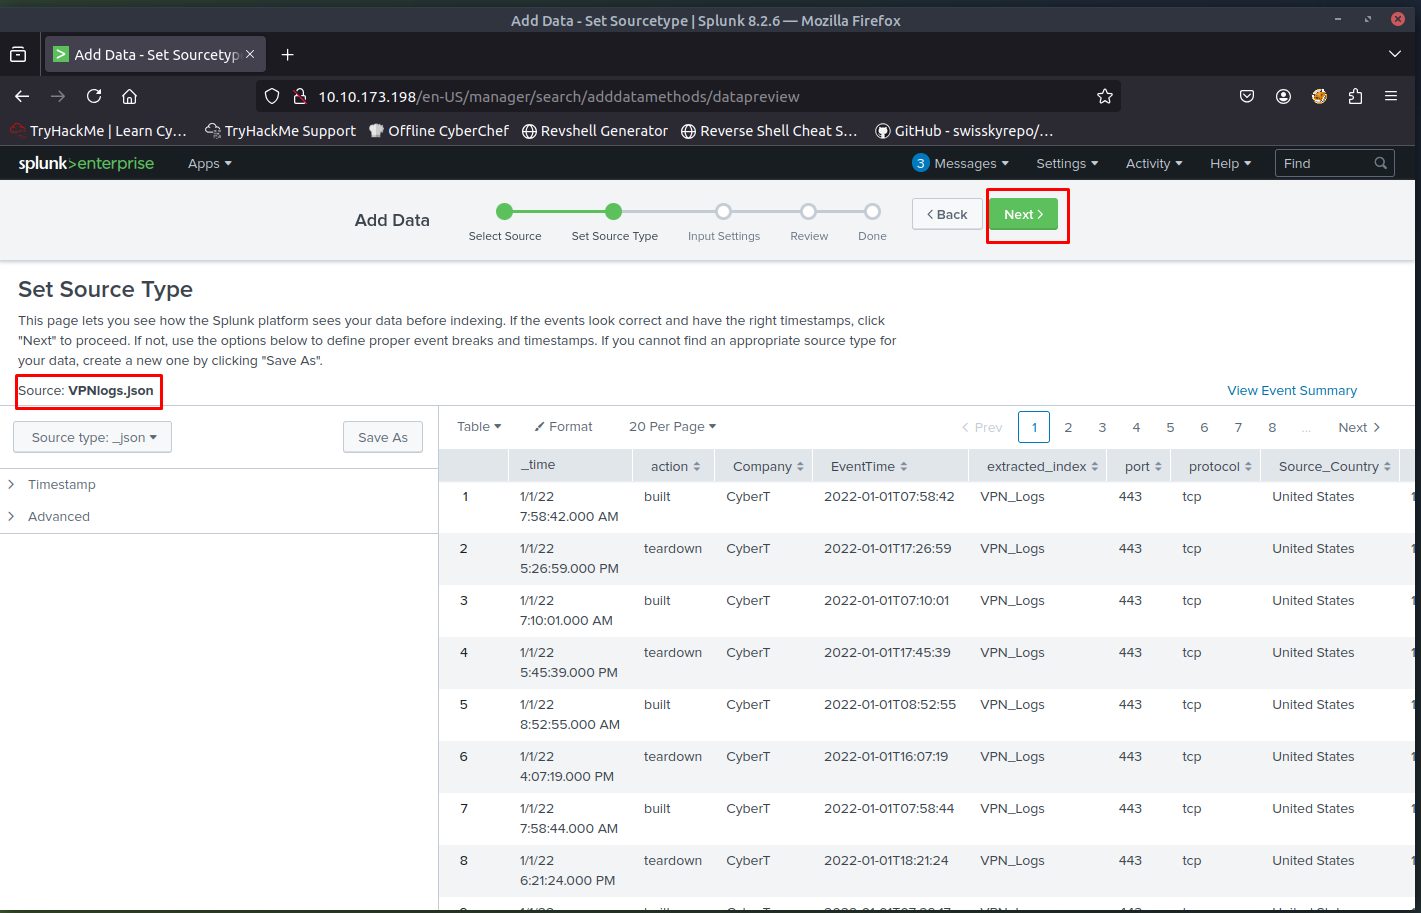
Select Source
Choose the log file (in this case,VPN_logs) from your local machine.Select Source Type
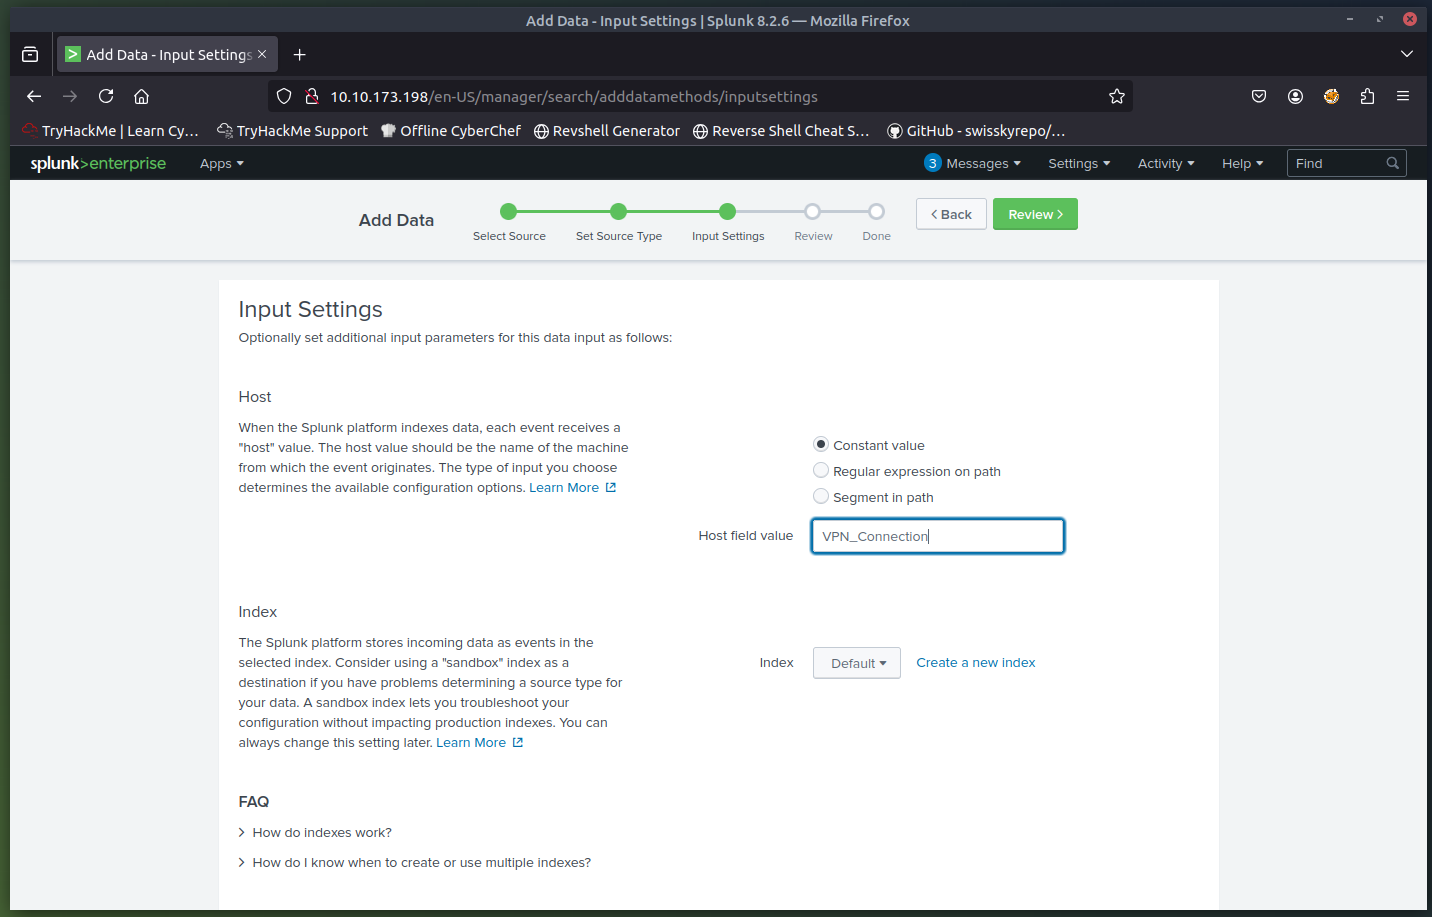
Define the type of log data being ingested (e.g., VPN logs).- Input Settings
- Choose the index where the logs will be stored
- Assign a host name to be associated with the logs
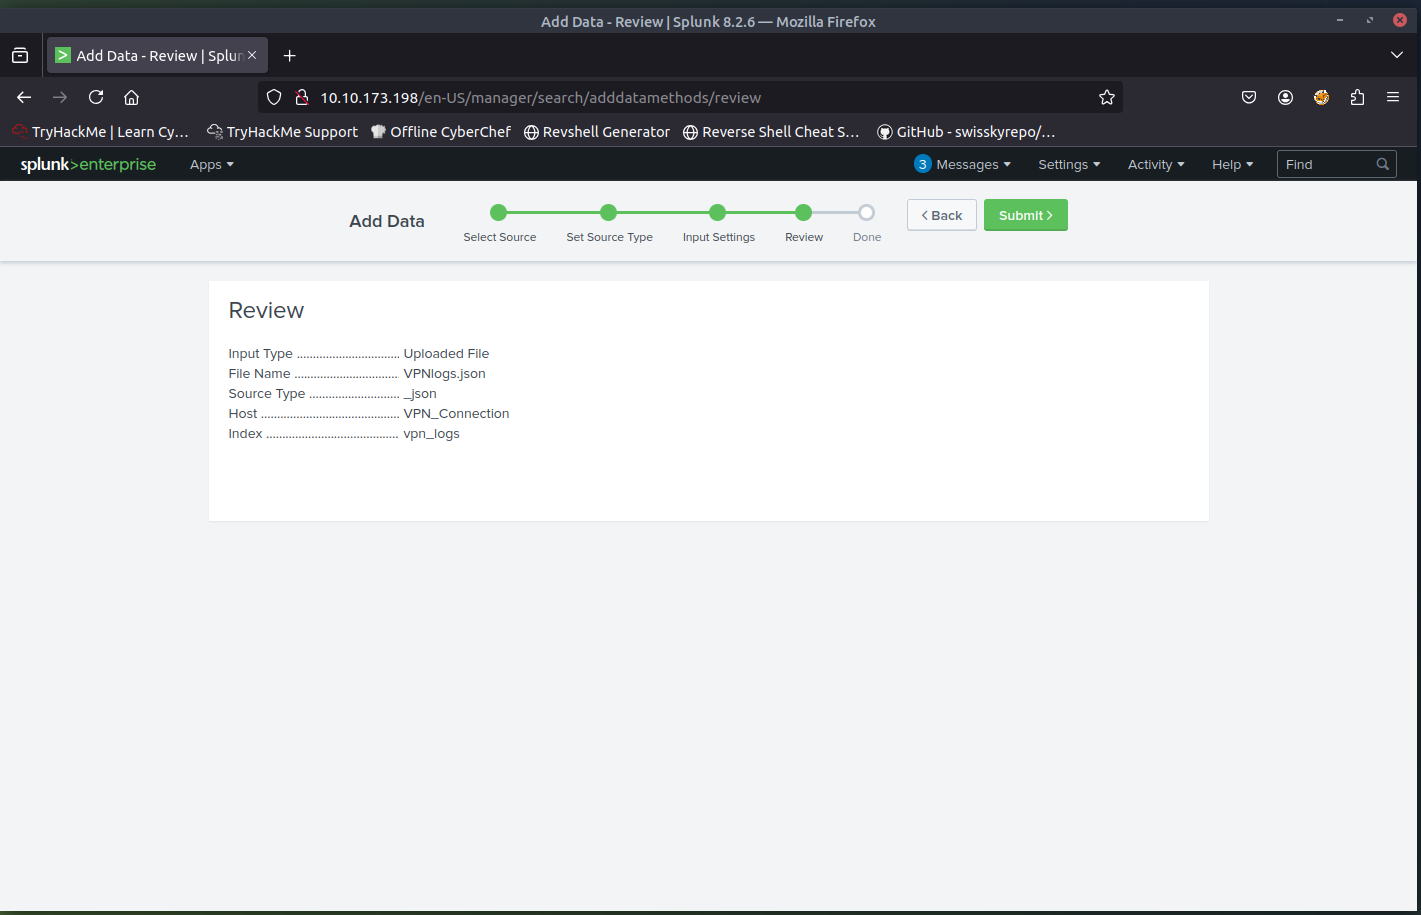
Review
Confirm all selections and settings.- Done
Data is successfully uploaded and ready for search and analysis.
Supported Source Types
Splunk supports many different log source types, far beyond just VPN logs. These include logs from:
- Web servers
- Security devices
- Operating systems
- Applications
- Custom sources
Explore and utilize the right source type for accurate field extraction and log interpretation.
✅ Once the VPN logs are uploaded and processed, you’ll be able to search, analyze, and visualize the data using Splunk’s powerful search interface.
Challenge
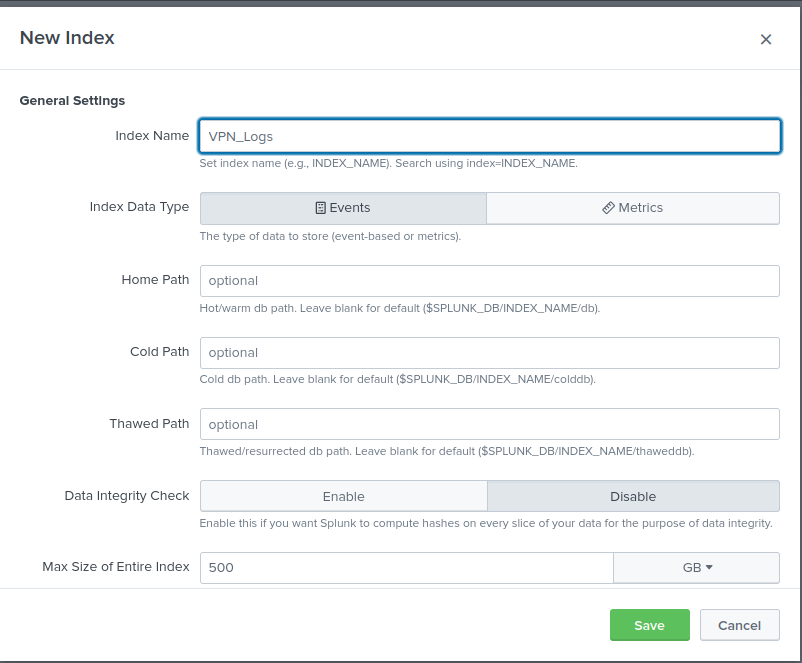
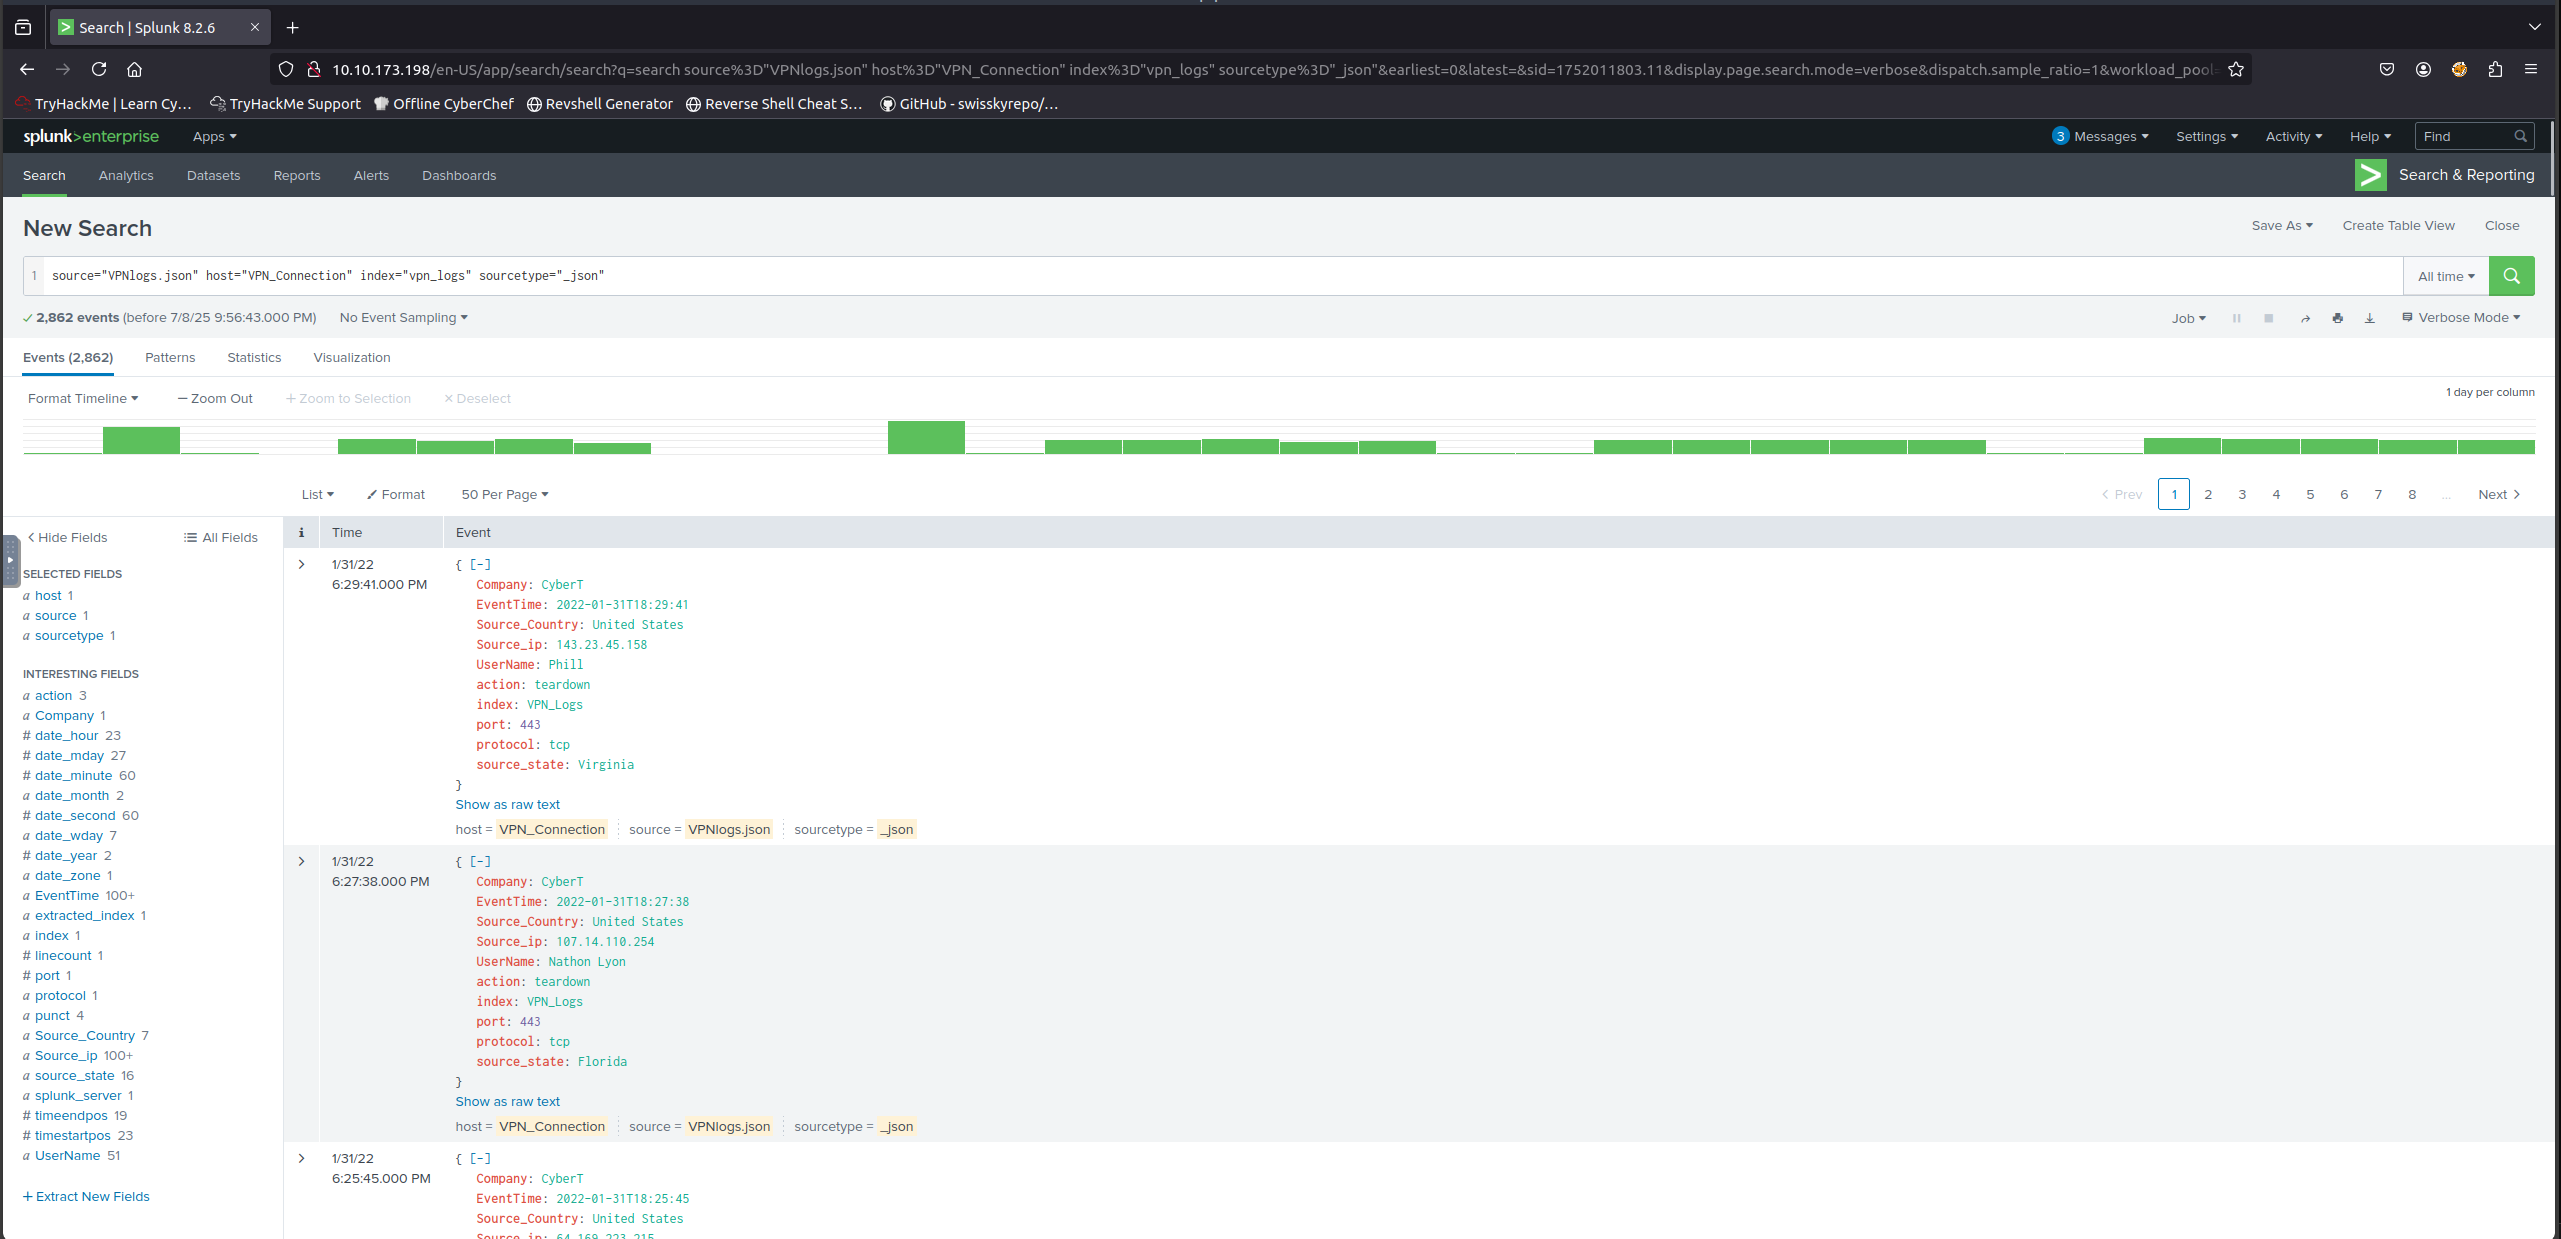
Upload the data attached to this task and create an index “VPN_Logs”. How many events are present in the log file?
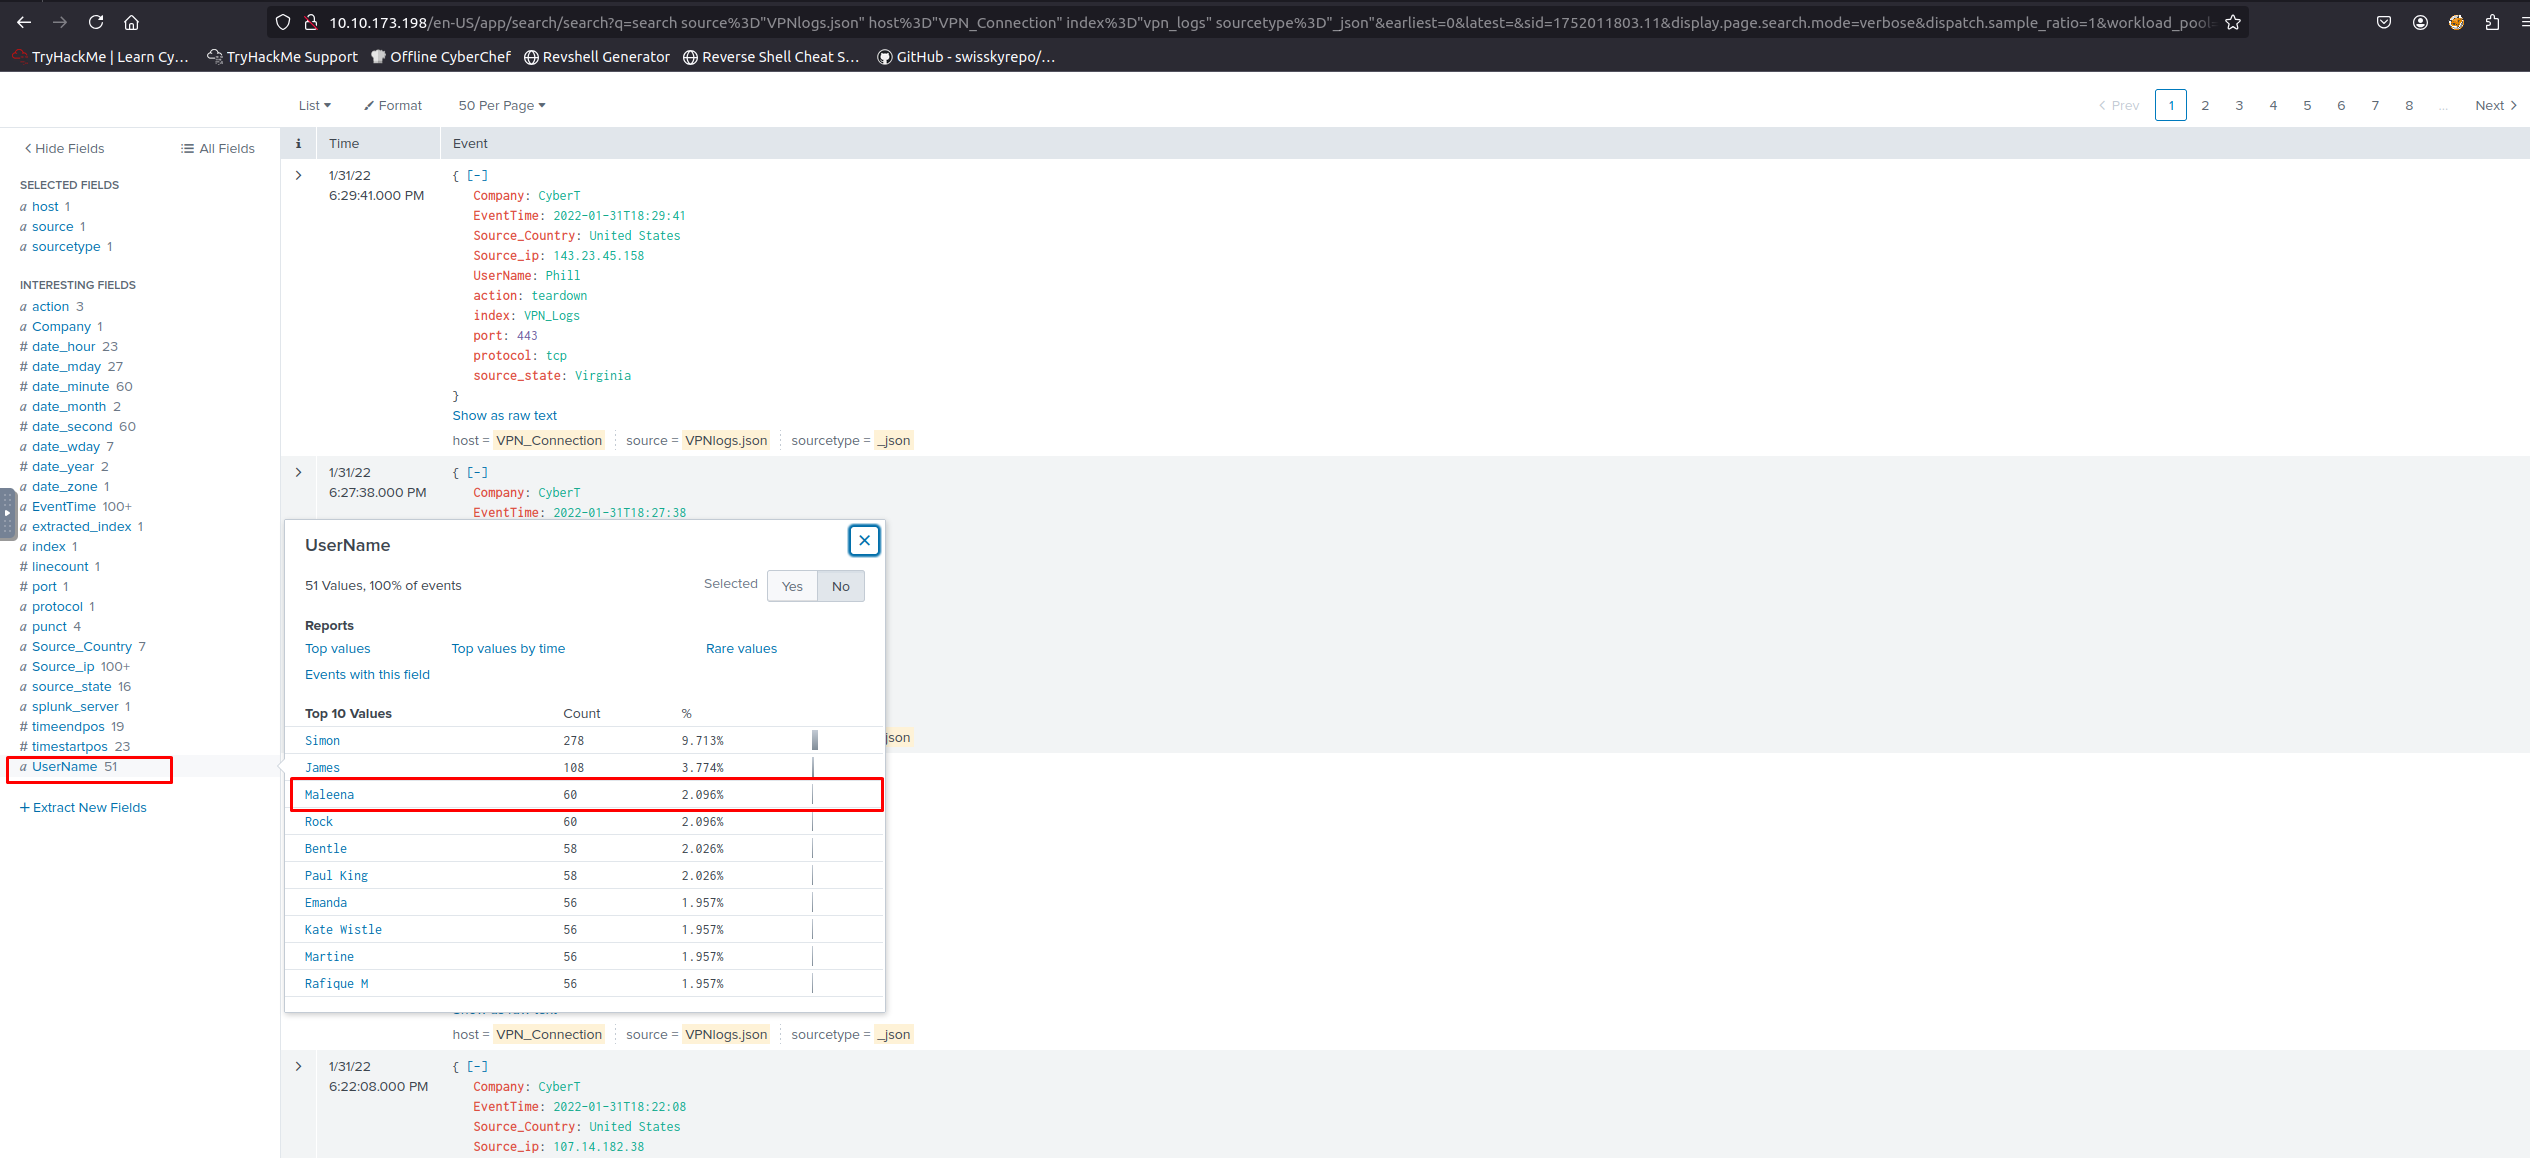
How many log events by the user Maleena are captured?
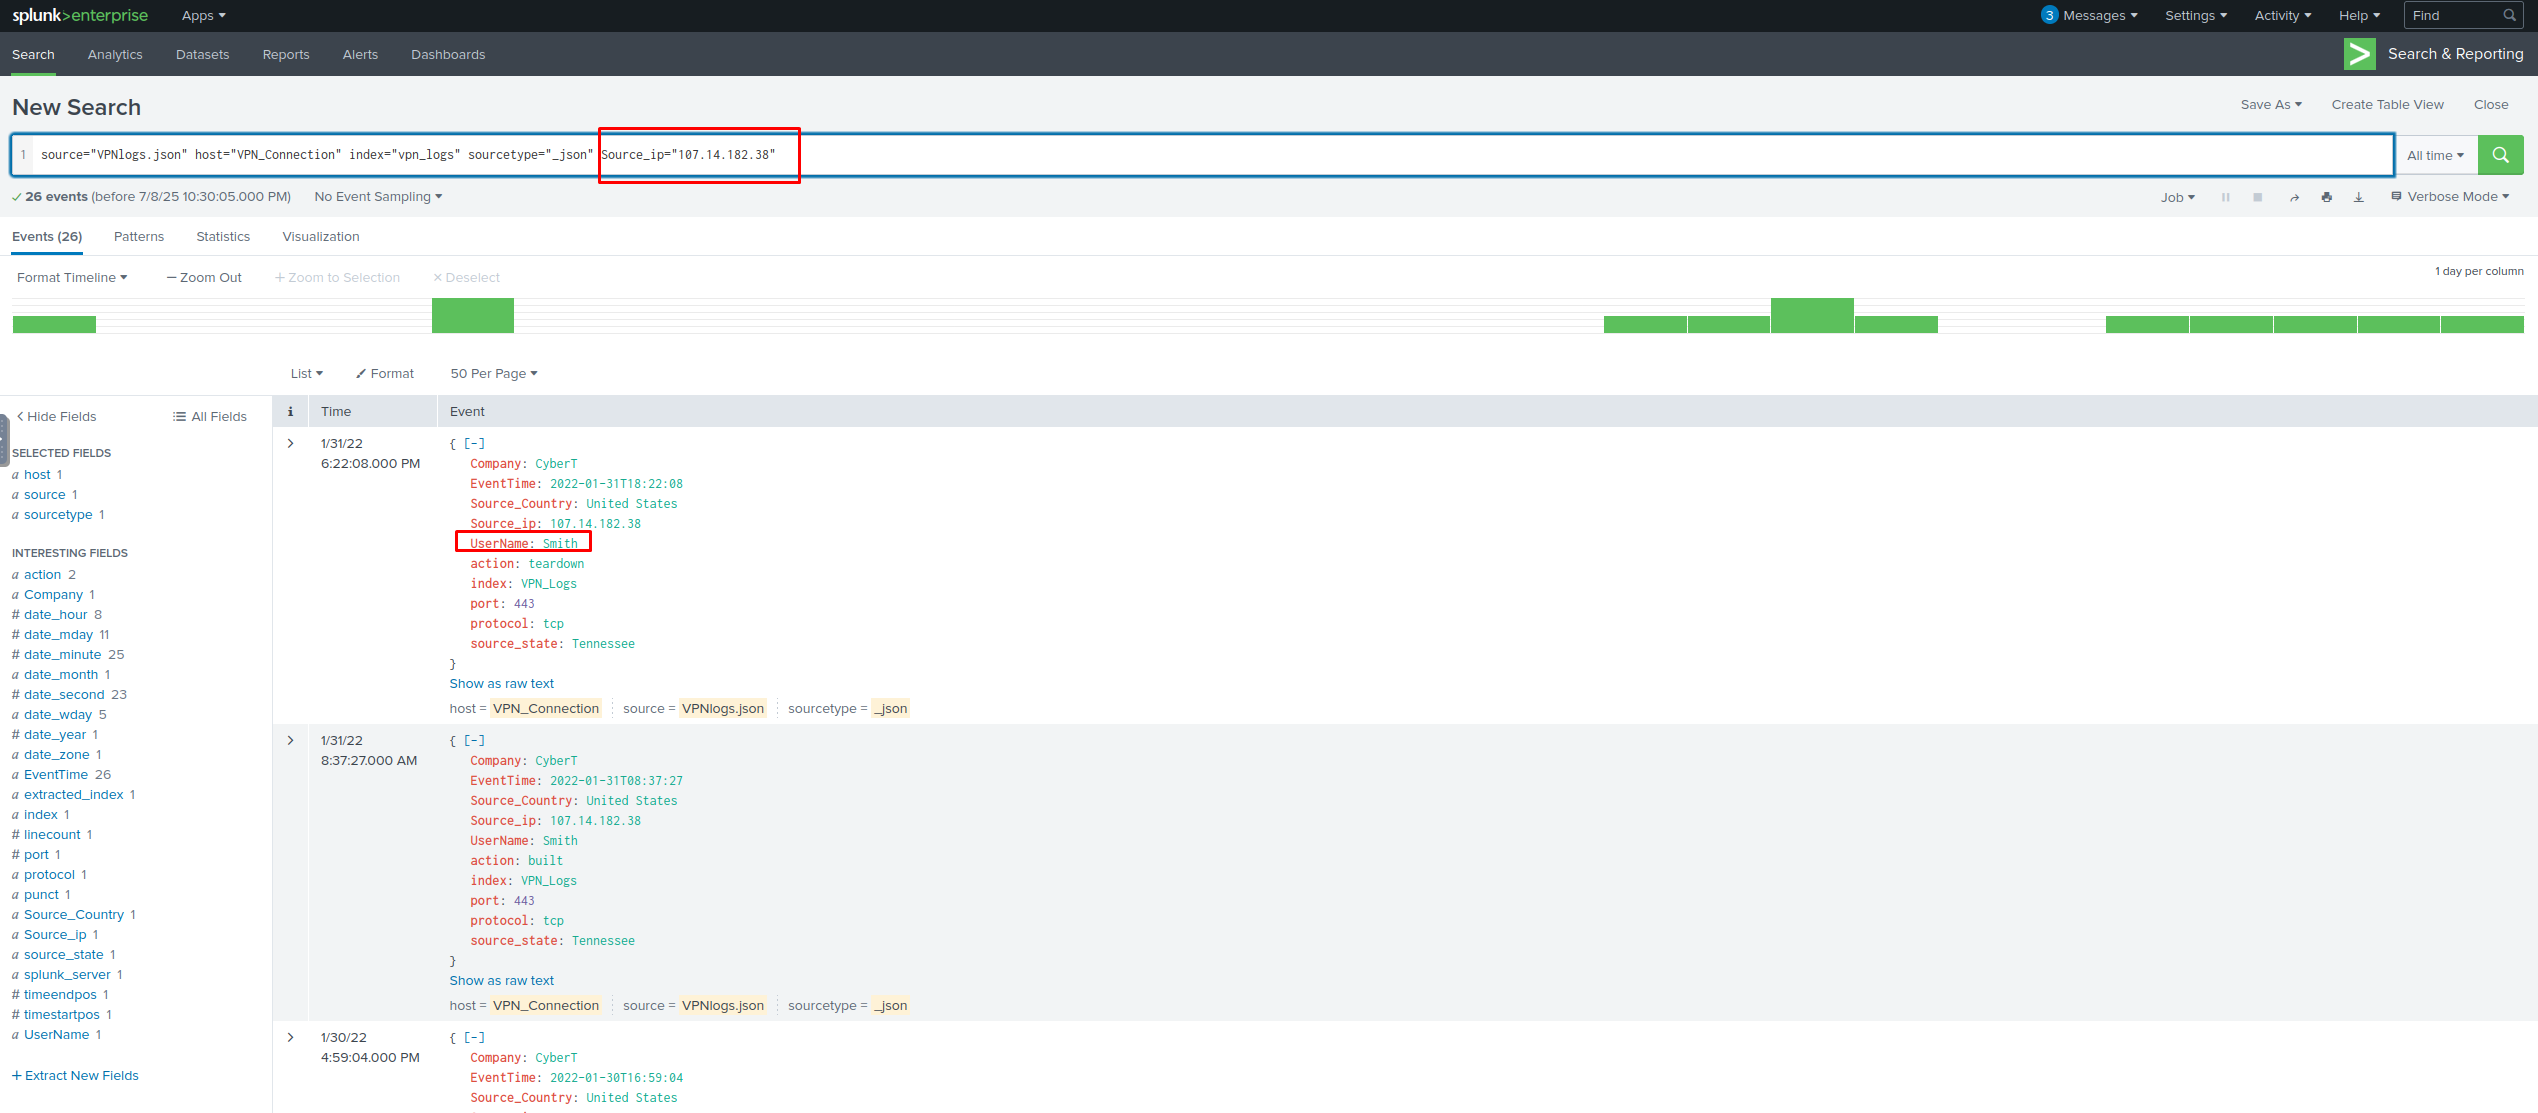
What is the name associated with IP 107.14.182.38?
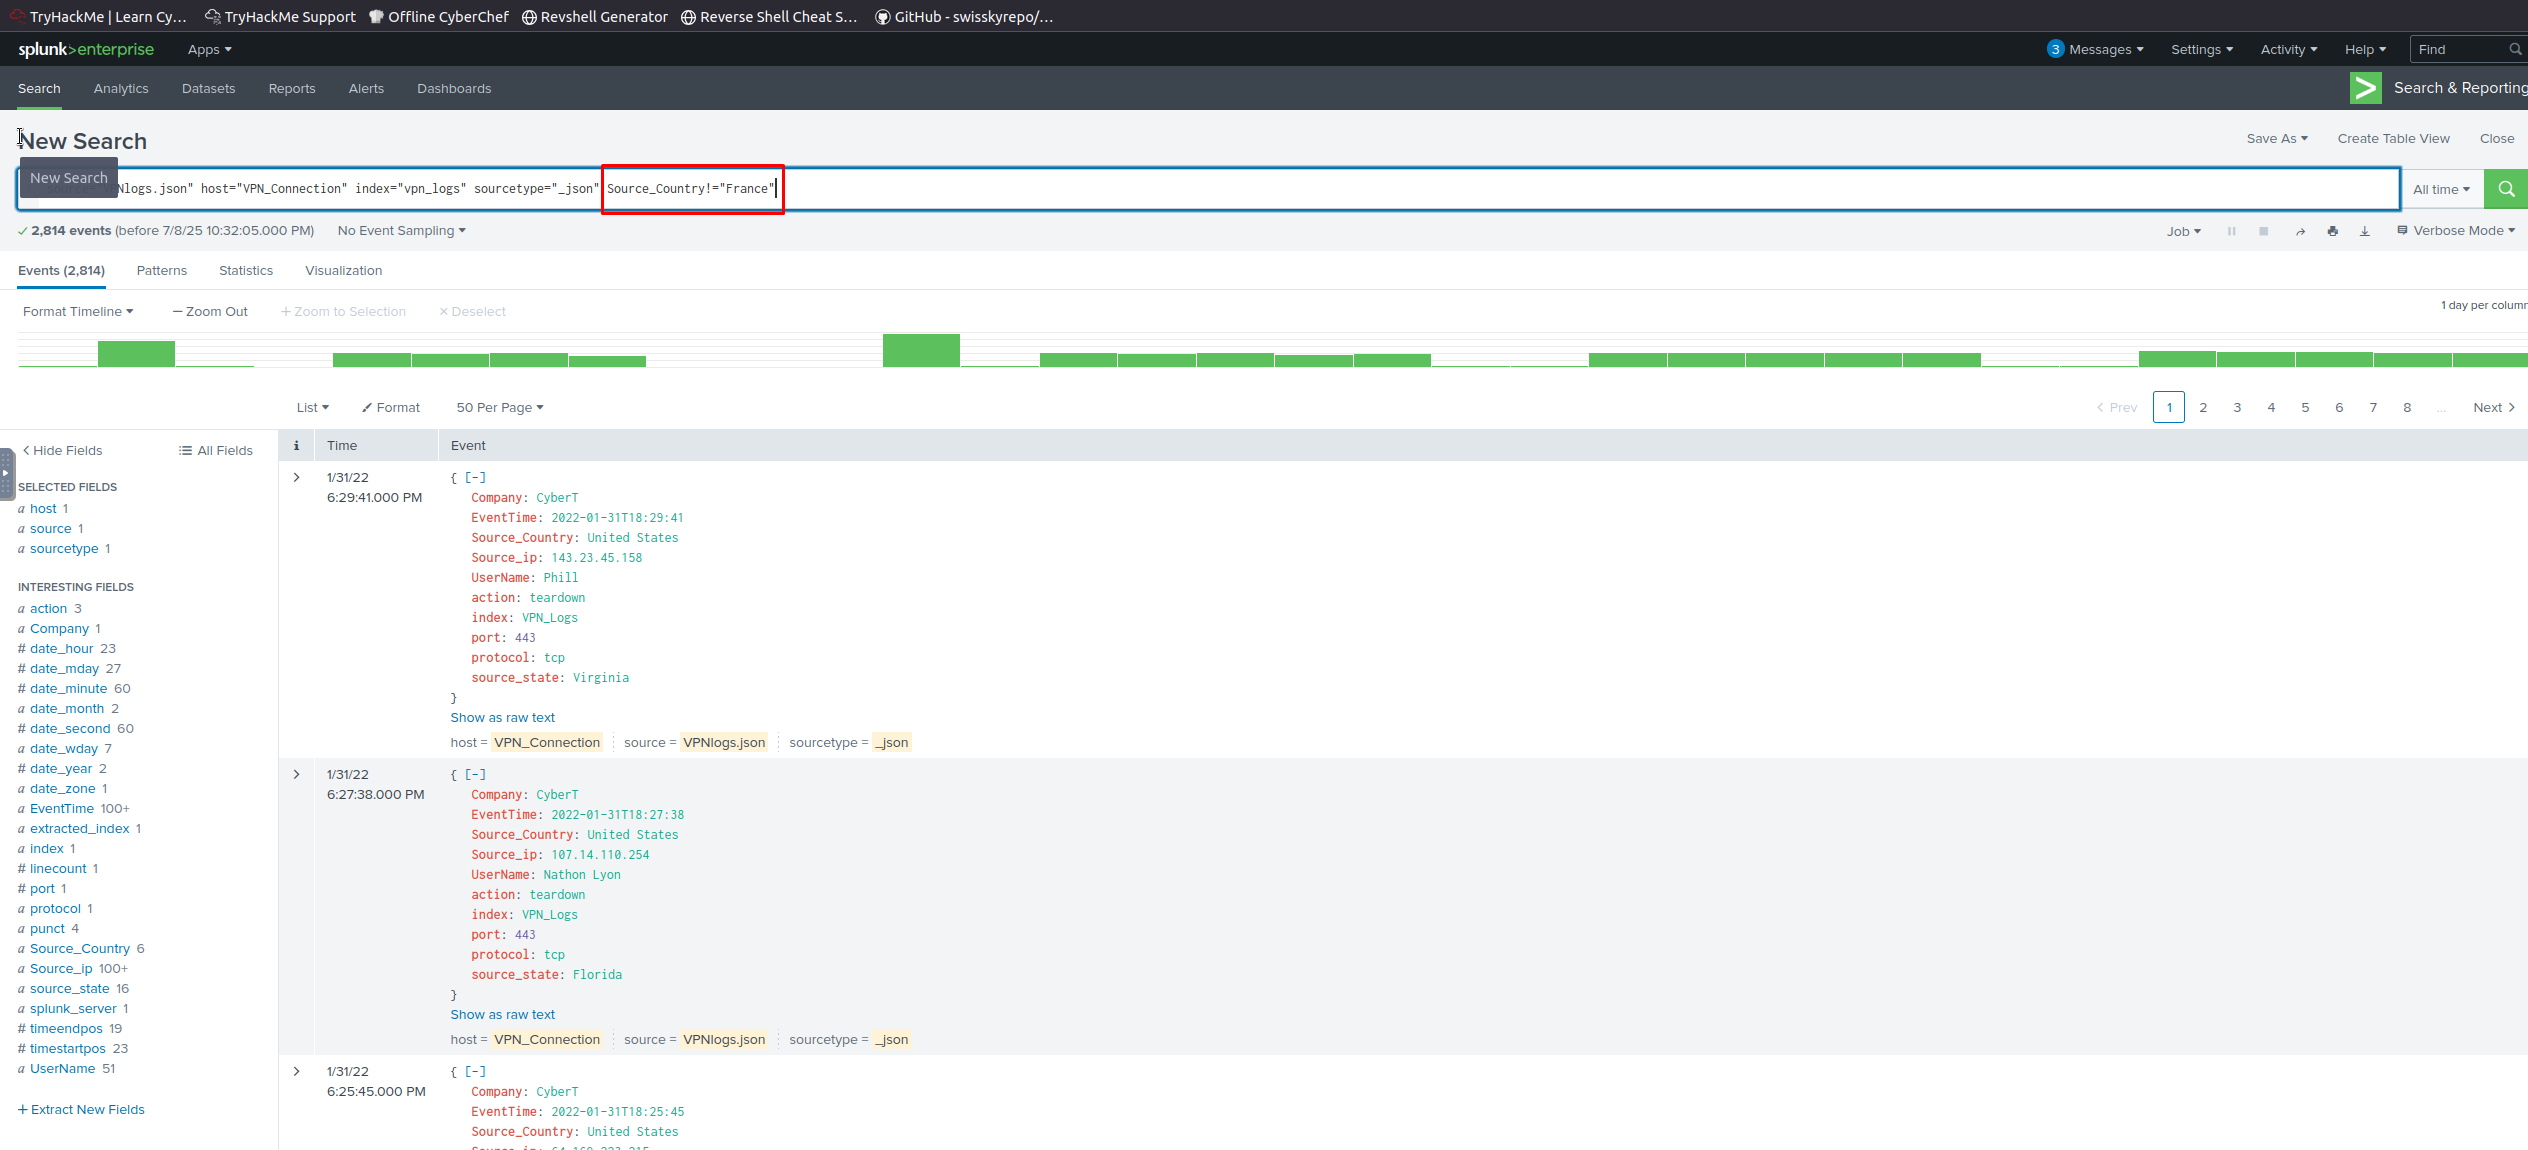
What is the number of events that originated from all countries except France?
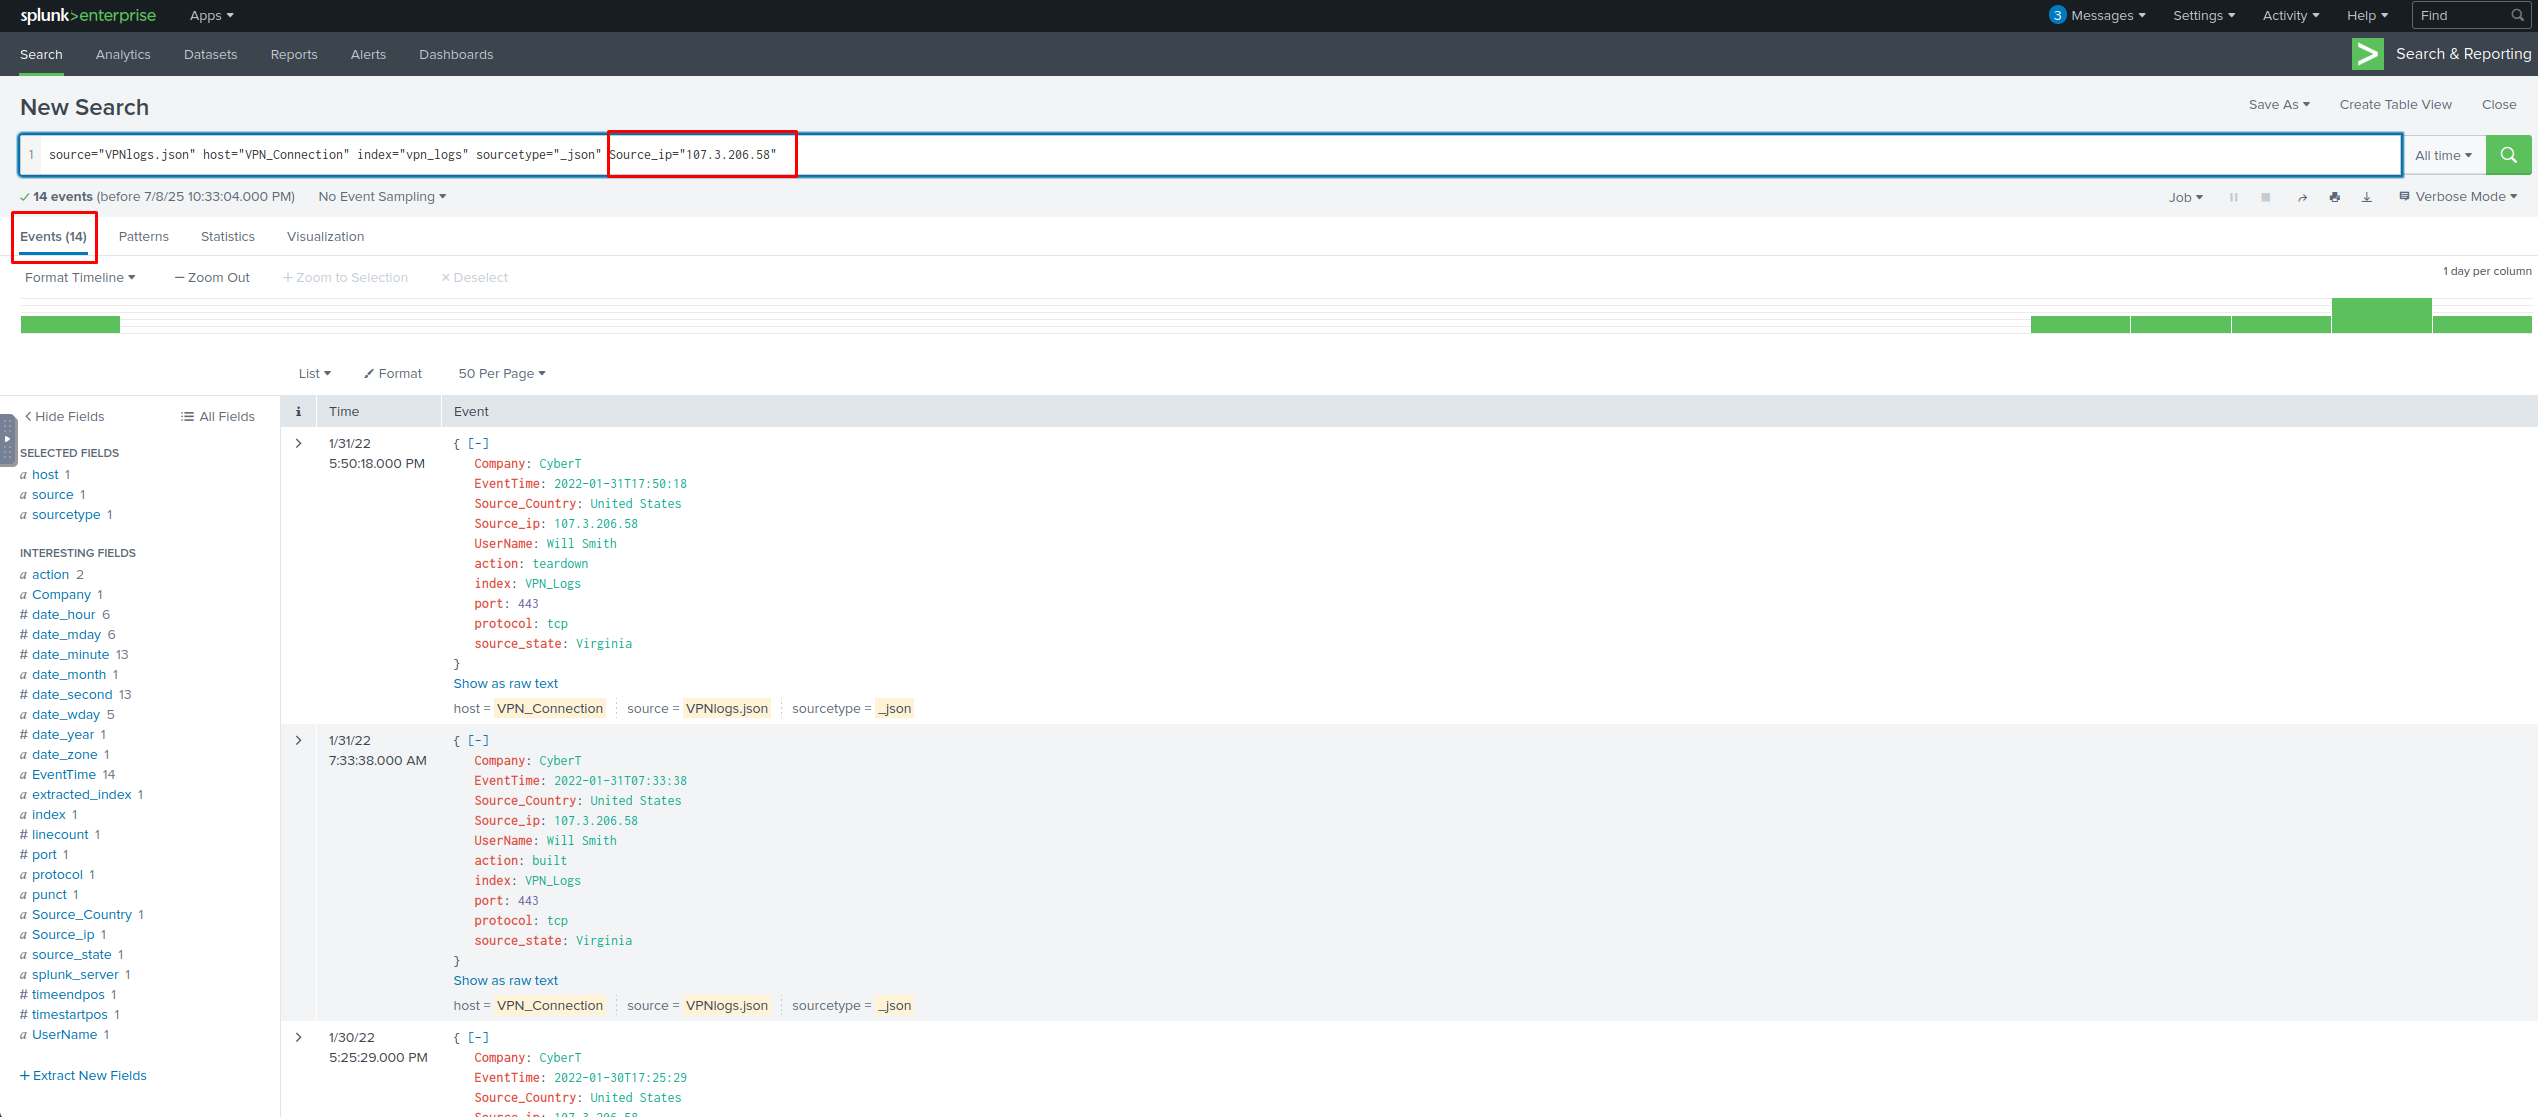
How many VPN Events were observed by the IP 107.3.206.58?