Investigating with ELK 101
Learn how to investigate VPN logs using the ELK Stack. This TryHackMe room teaches you how to analyze logs through Kibana, detect anomalies, and build visualizations in a real-world SOC scenario.
Intro
This room has the following learning objectives:
- How to perform searches, apply a filter, save search.
- How to create visualizations.
- Investigate VPN logs to identify anomalies.
- To create a dashboard using saved searches and - visualizations.
Incident Handling Scenario
A US-based company CyberT has been monitoring the VPN logs of the employees, and the SOC team detected some anomalies in the VPN activities. Our task as SOC Analysts is to examine the VPN logs for January 2022 and identify the anomalies. Some of the key points to note before the investigation are:
- All VPN logs are being ingested into the index
vpn_connections. - The index contains the VPN logs for January 2022.
- A user
Johny Brownwas terminated on 1st January 2022. - We observed failed connection attempts against some users that need to be investigated.
Elastic stack
Elastic stack is the collection of different open source components linked together to help users take the data from any source and in any format and perform a search, analyze and visualize the data in real-time.
Elasticsearch
Elasticsearch is a full-text search and analytics engine used to store JSON-formated documents. Elasticsearch is an important component used to store, analyze, perform correlation on the data, etc. Elasticsearch supports RESTFul API to interact with the data.
Logstash
Logstash is a data processing engine used to take the data from different sources, apply the filter on it or normalize it, and then send it to the destination which could be Kibana or a listening port. A logstash configuration file is divided into three parts, as shown below.
The input part is where the user defines the source from which the data is being ingested. Logstash supports many input plugins as shown in the reference https://www.elastic.co/guide/en/logstash/8.1/input-plugins.html
The filter part is where the user specifies the filter options to normalize the log ingested above. Logstash supports many filter plugins as shown in the reference documentation https://www.elastic.co/guide/en/logstash/8.1/filter-plugins.html
The Output part is where the user wants the filtered data to send. It can be a listening port, Kibana Interface, elasticsearch database, a file, etc. Logstash supports many Output plugins as shown in the reference documentation https://www.elastic.co/guide/en/logstash/8.1/output-plugins.html
Beats
Beats is a host-based agent known as Data-shippers that is used to ship/transfer data from the endpoints to elasticsearch. Each beat is a single-purpose agent that sends specific data to the elasticsearch. All available beats are shown below.
Kibana
Kibana is a web-based data visualization that works with elasticsearch to analyze, investigate and visualize the data stream in real-time. It allows the users to create multiple visualizations and dashboards for better visibility—more on Kibana in the following tasks.
- Beats is a set of different data shipping agents used to collect data from multiple agents. Like Winlogbeat is used to collect windows event logs, Packetbeat collects network traffic flows.
- Logstash collects data from beats, ports or files, etc., parses/normalizes it into field value pairs, and stores them into elasticsearch.
- Elasticsearch acts as a database used to search and analyze the data.
- Kibana is responsible for displaying and visualizing the data stored in elasticsearch. The data stored in elasticseach can easily be shaped into different visualizations, time charts, infographics, etc., using Kibana.
Room Credentials
Username: Analyst
Password: analyst123
Kibana Discover Tab
The Kibana Discover tab is where analysts spend most of their time. This tab displays the ingested logs (also known as documents), the search bar, normalized fields, and more.
Here, analysts can perform the following tasks:
- 🔍 Search for logs
- ⚠️ Investigate anomalies
- 🎯 Apply filters based on:
- Search term
- Time period
Discover Tab
Discover tab within the Kibana interface contains the logs being ingested manually or in real-time, the time-chart, normalized fields, etc. Analysts use this tab mostly to search/investigate the logs using the search bar and filter options.
Kibana Dashboard Interface Overview
The Kibana Dashboard provides a centralized interface for analyzing and interacting with ingested logs. Below are key components and their functionality:
🗂️ Logs (Documents)
Each log is known as a document containing event-related information. It shows the fields and values extracted from the event.
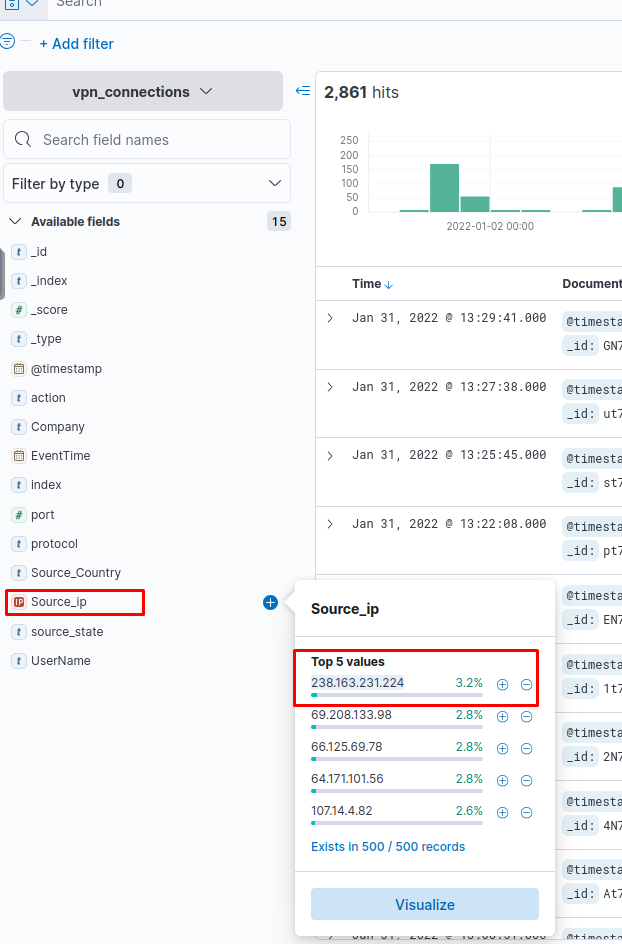
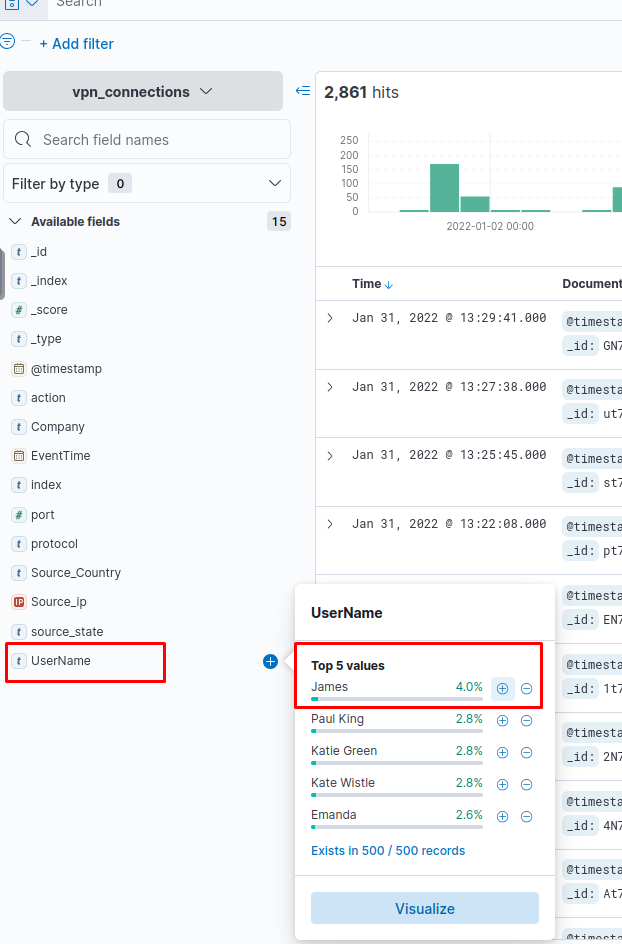
📋 Fields Pane
Located on the left panel, this shows a list of parsed fields. You can:
- Click on a field to add/remove it from the filter.
- View top values and their percentages.
- Use the
+button to include logs with that field value. - Use the
-button to exclude logs with that field value.
📊 Index Pattern
- Allows users to select from the available index patterns.
- Defines which Elasticsearch data Kibana will query.
- Each log source typically uses a dedicated index pattern.
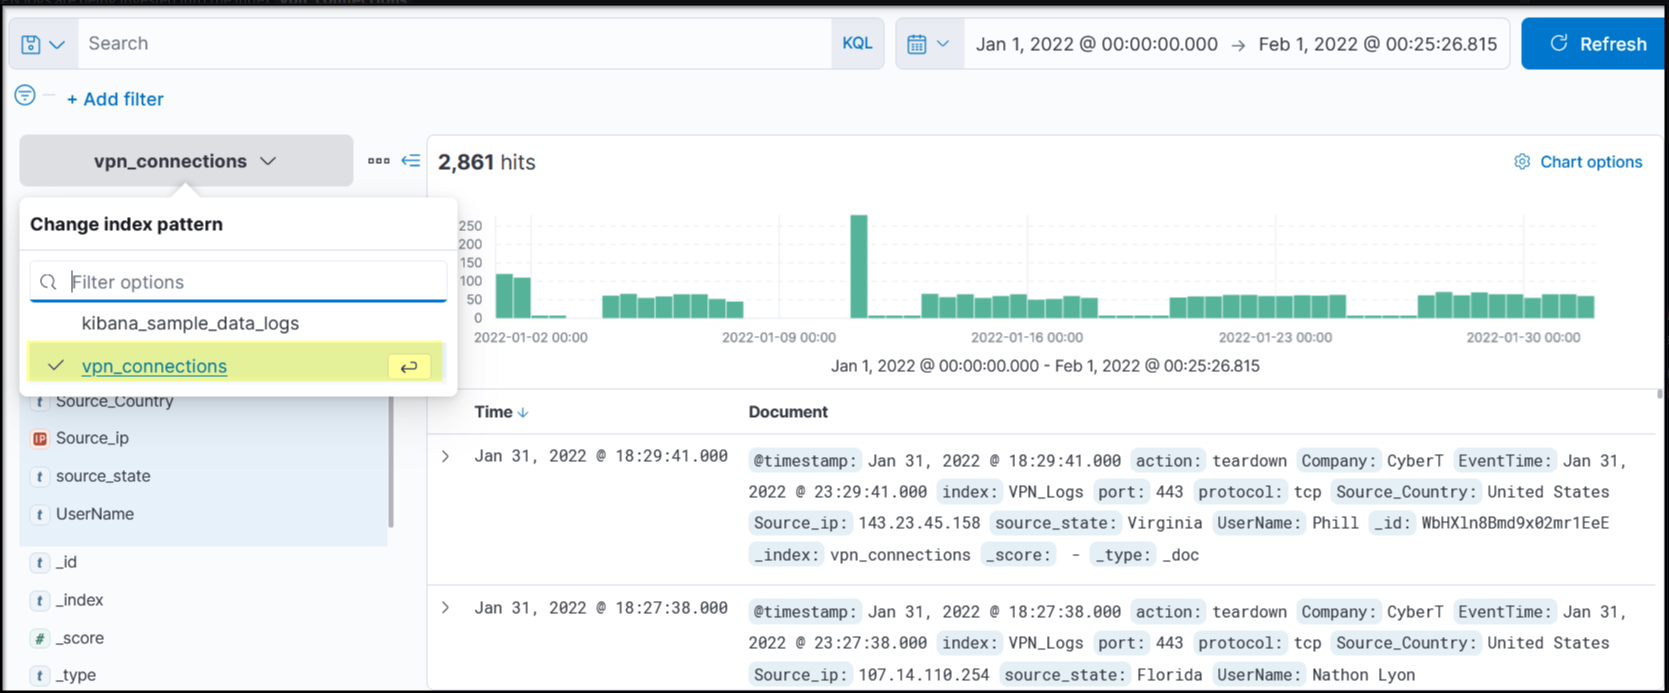
🔍 In the attached lab, we use an index pattern called vpn_connections for VPN logs.
🔎 Search Bar
The main area to input:
- Search queries
- Filters to narrow down results
⏱️ Time Filter
Filter logs based on time duration using this section. It provides many time selection options.
Quick Select
- Offers predefined time ranges
- Includes auto-refresh options like every 5 seconds
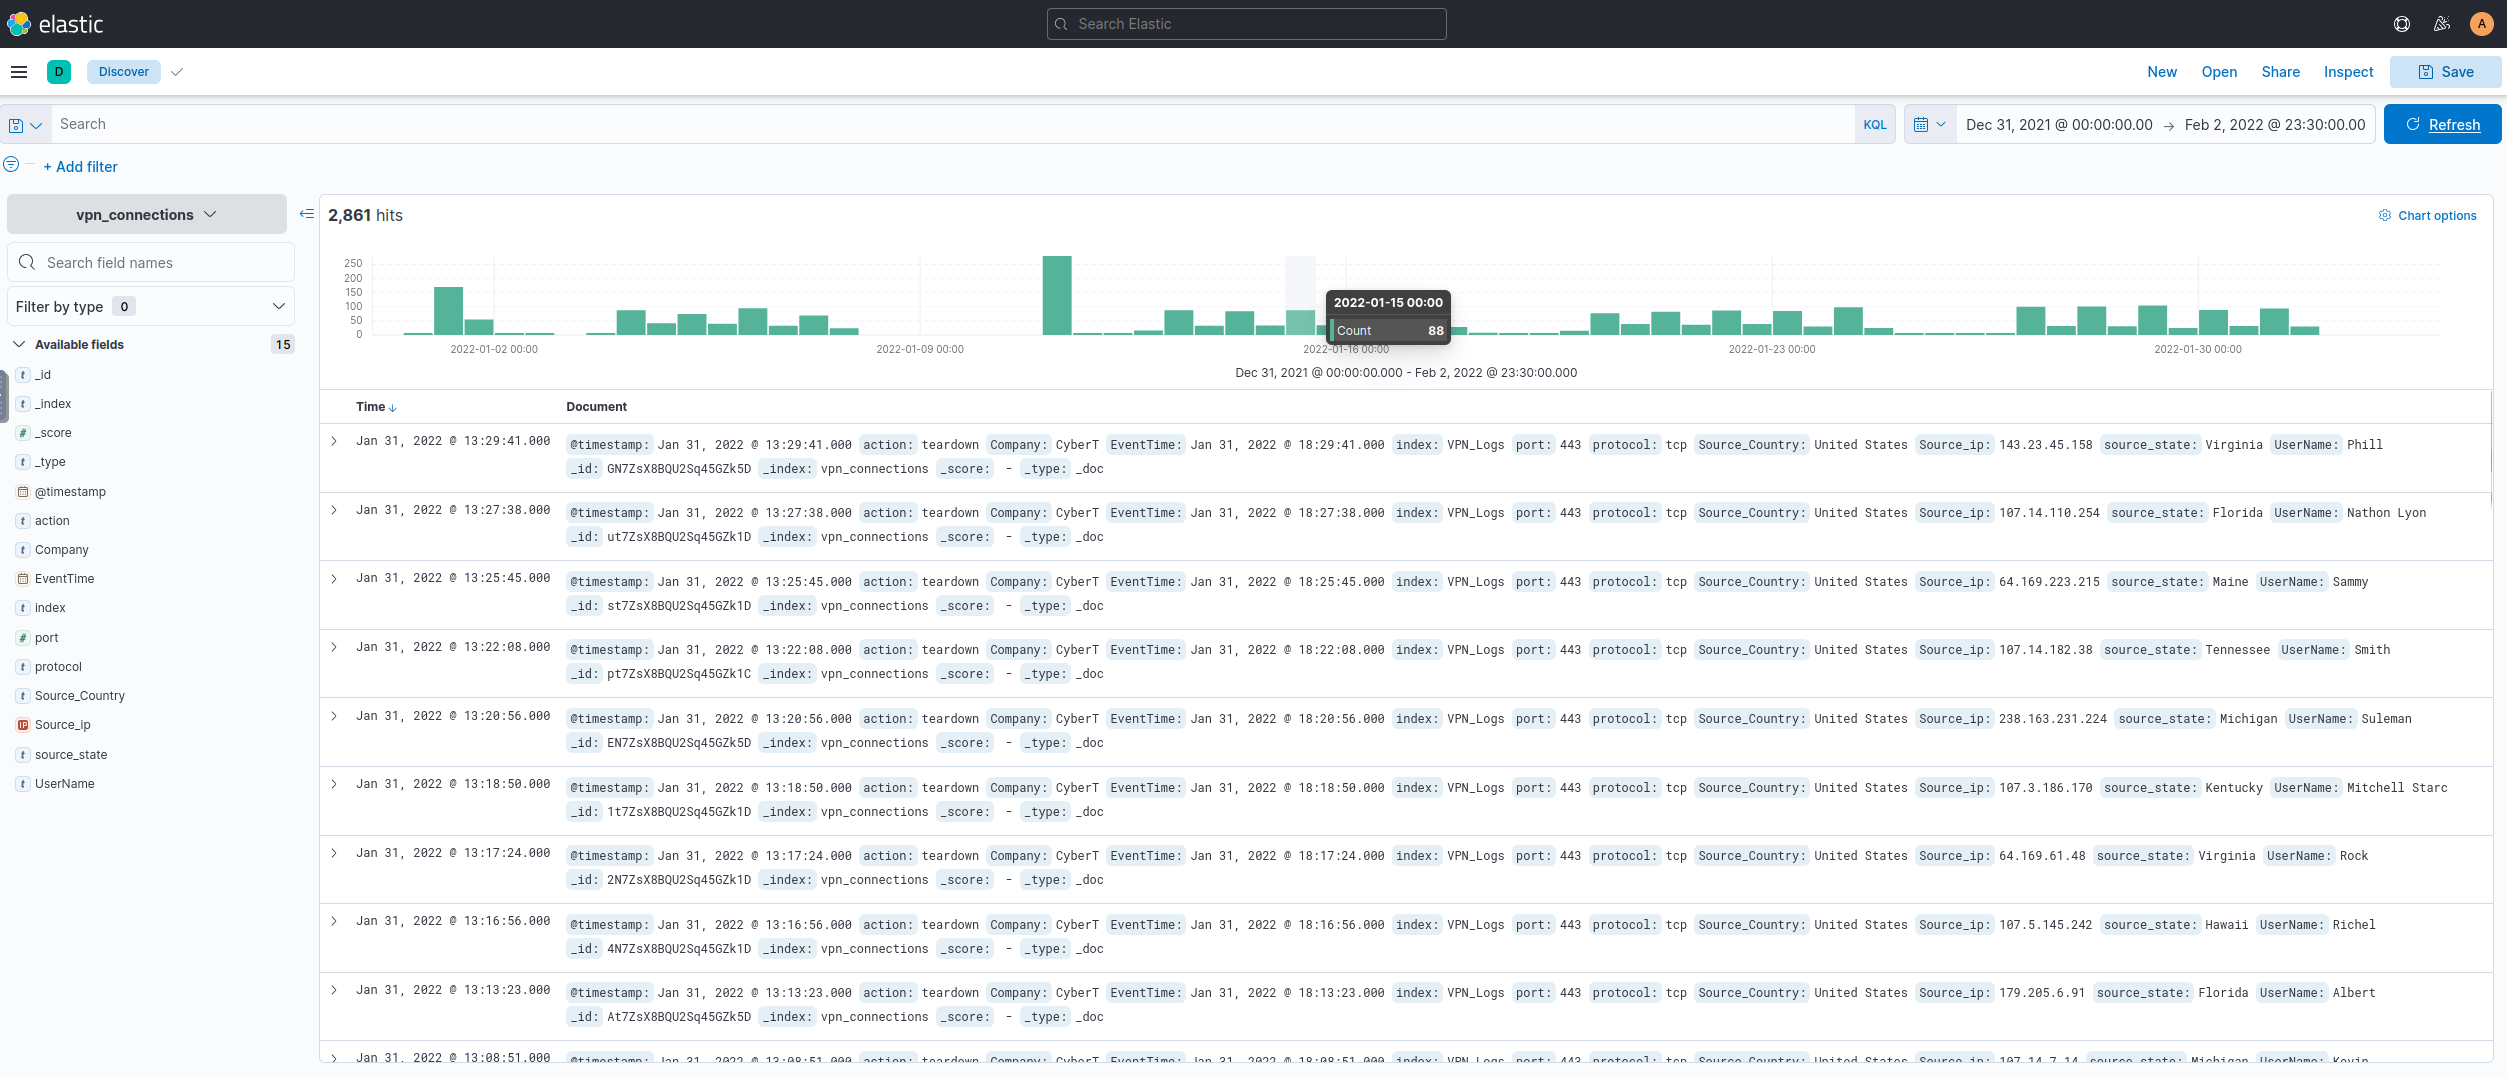
📈 Timeline
- Displays a graph of event counts over time
- Useful for spotting spikes (e.g., an unusual spike on January 11, 2022 worth investigating)
- Click a bar to filter logs to that time range
🔝 Top Bar
Contains options to:
- Save and open saved searches
- Share searches
- Export search results
Additional Features in Discover Tab
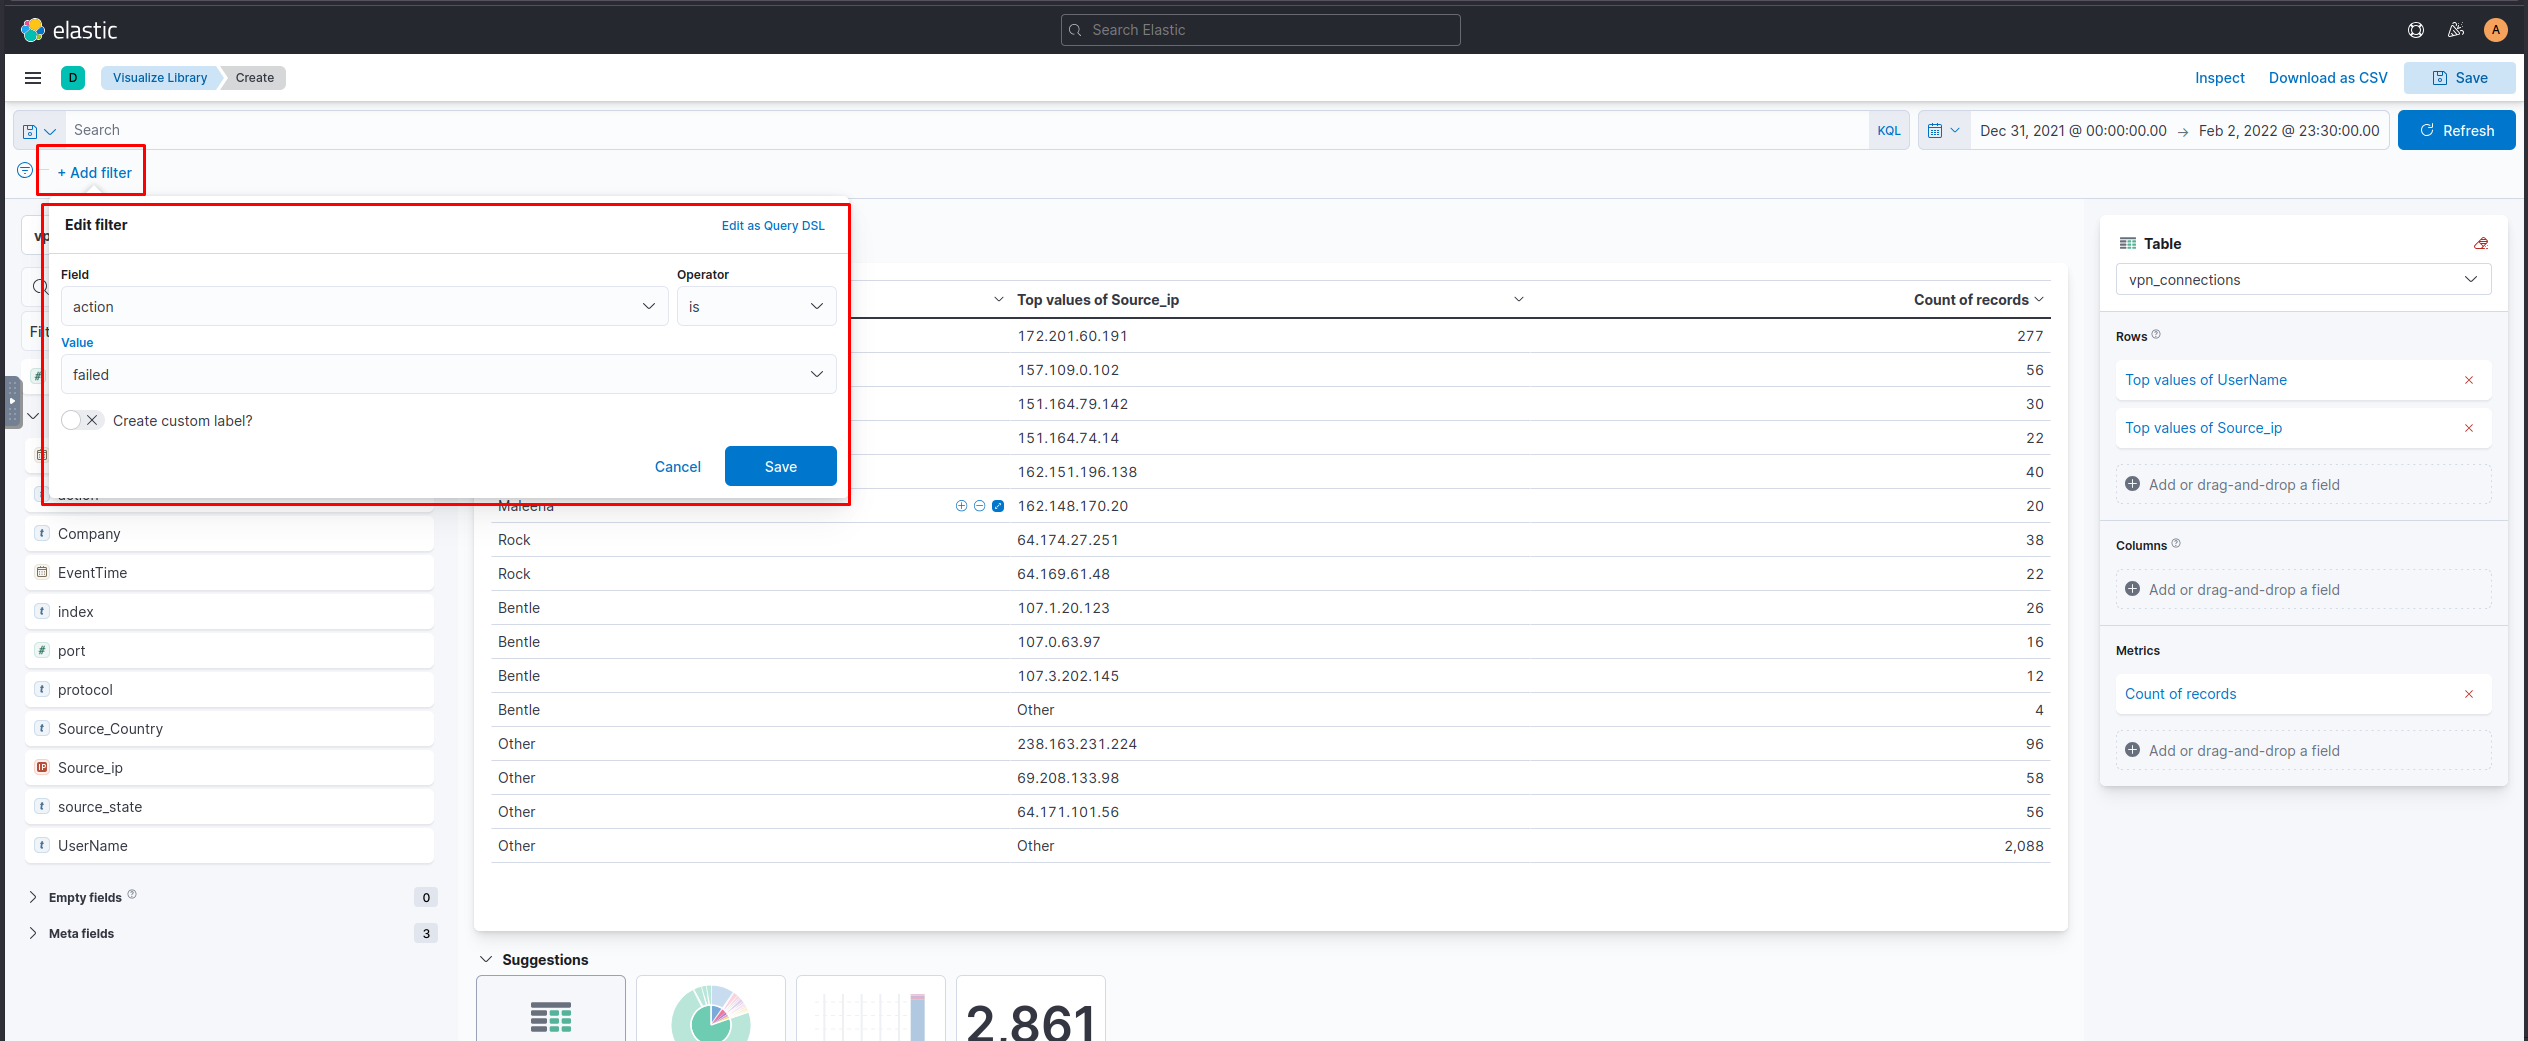
🔘 Add Filter Option
Below the search bar, the Add filter feature lets you:
- Choose a field
- Define a condition (e.g., is, is not, contains)
- Apply it to refine your search
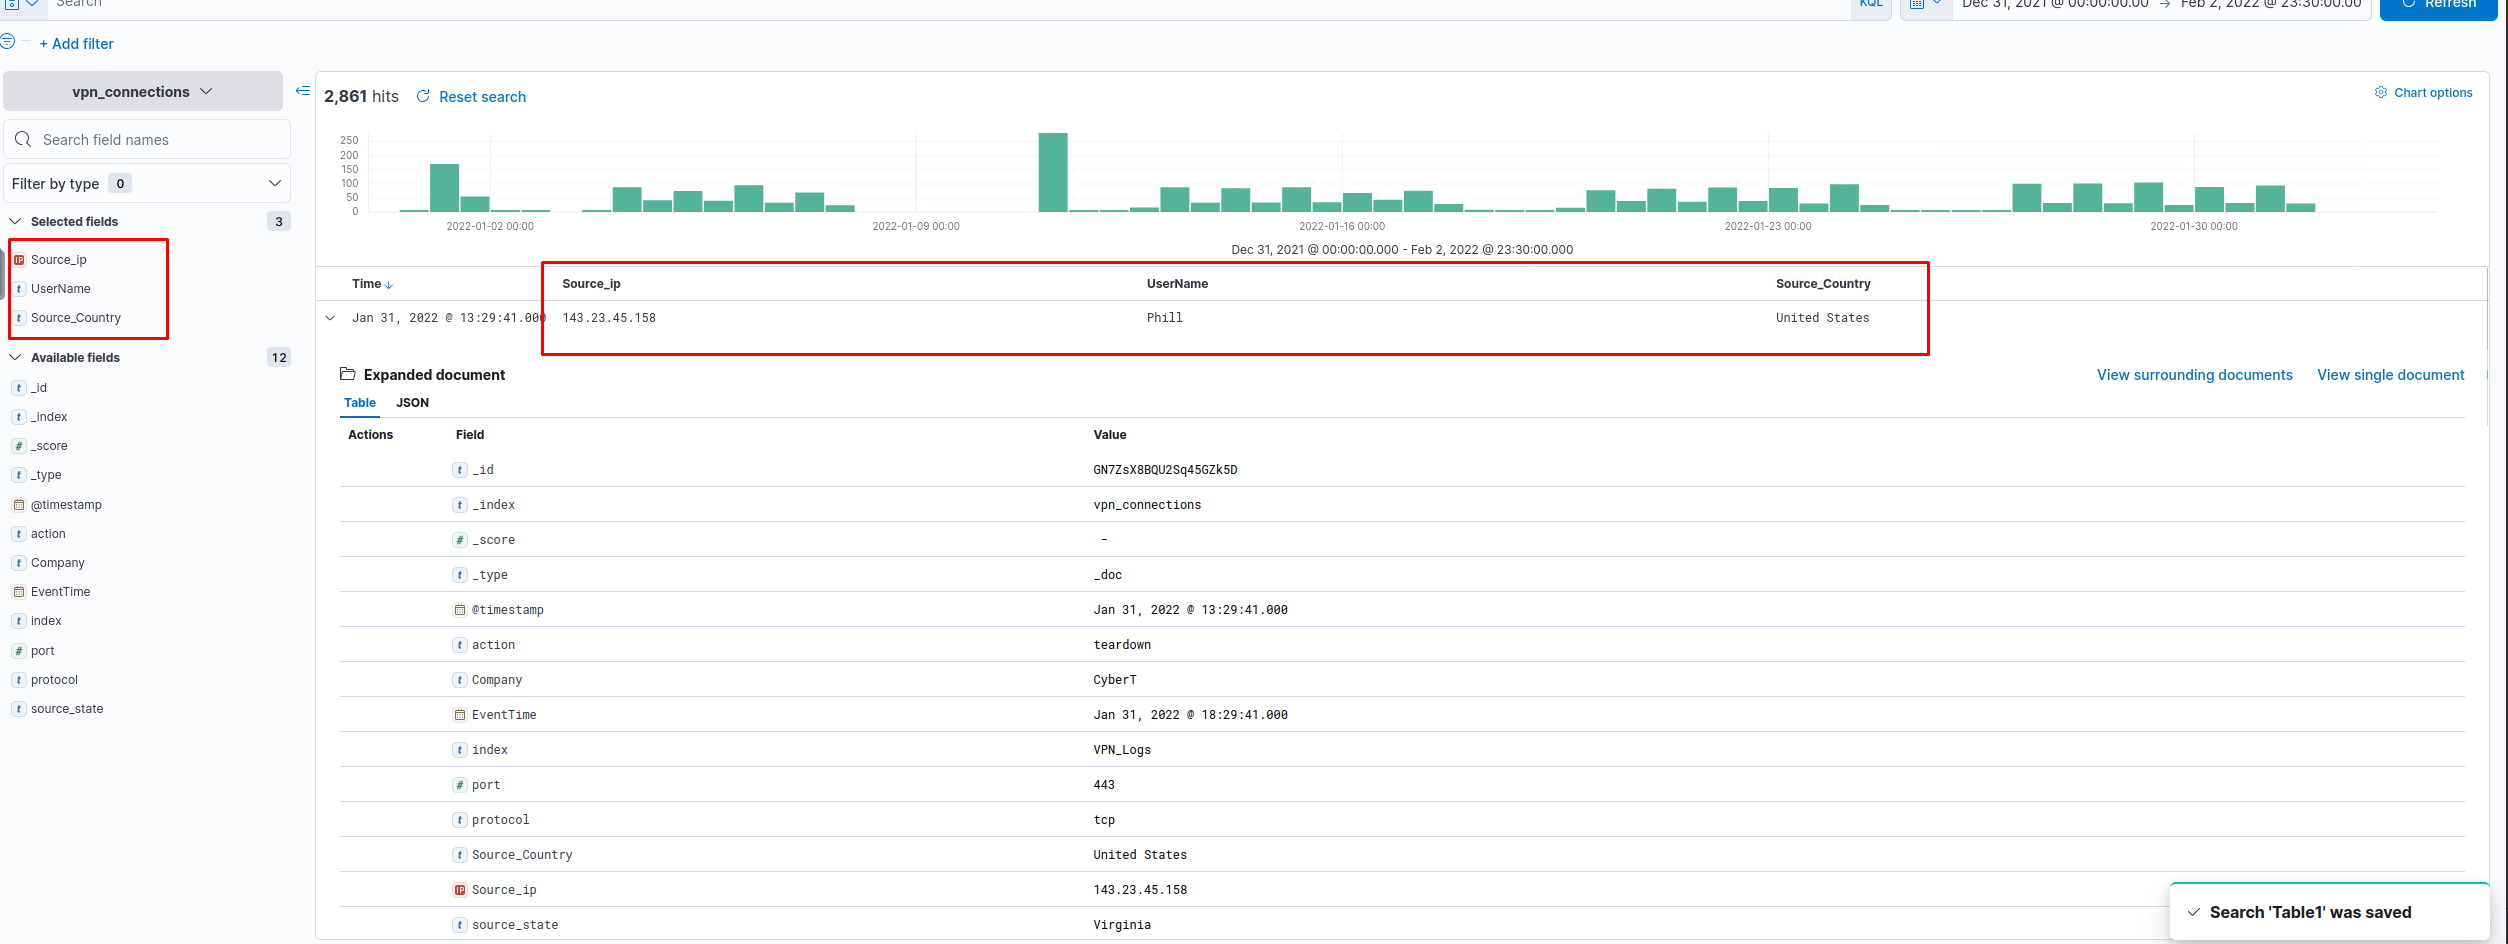
📑 Create Table View
By default, documents are in raw format.
- Click on a document
- Select important fields to include in a table view
- Helps reduce noise and highlight relevant data
- Don’t forget to save the table format so it persists across sessions
By understanding these elements, analysts can efficiently explore logs, identify anomalies, and generate meaningful insights in Kibana.
Challenge
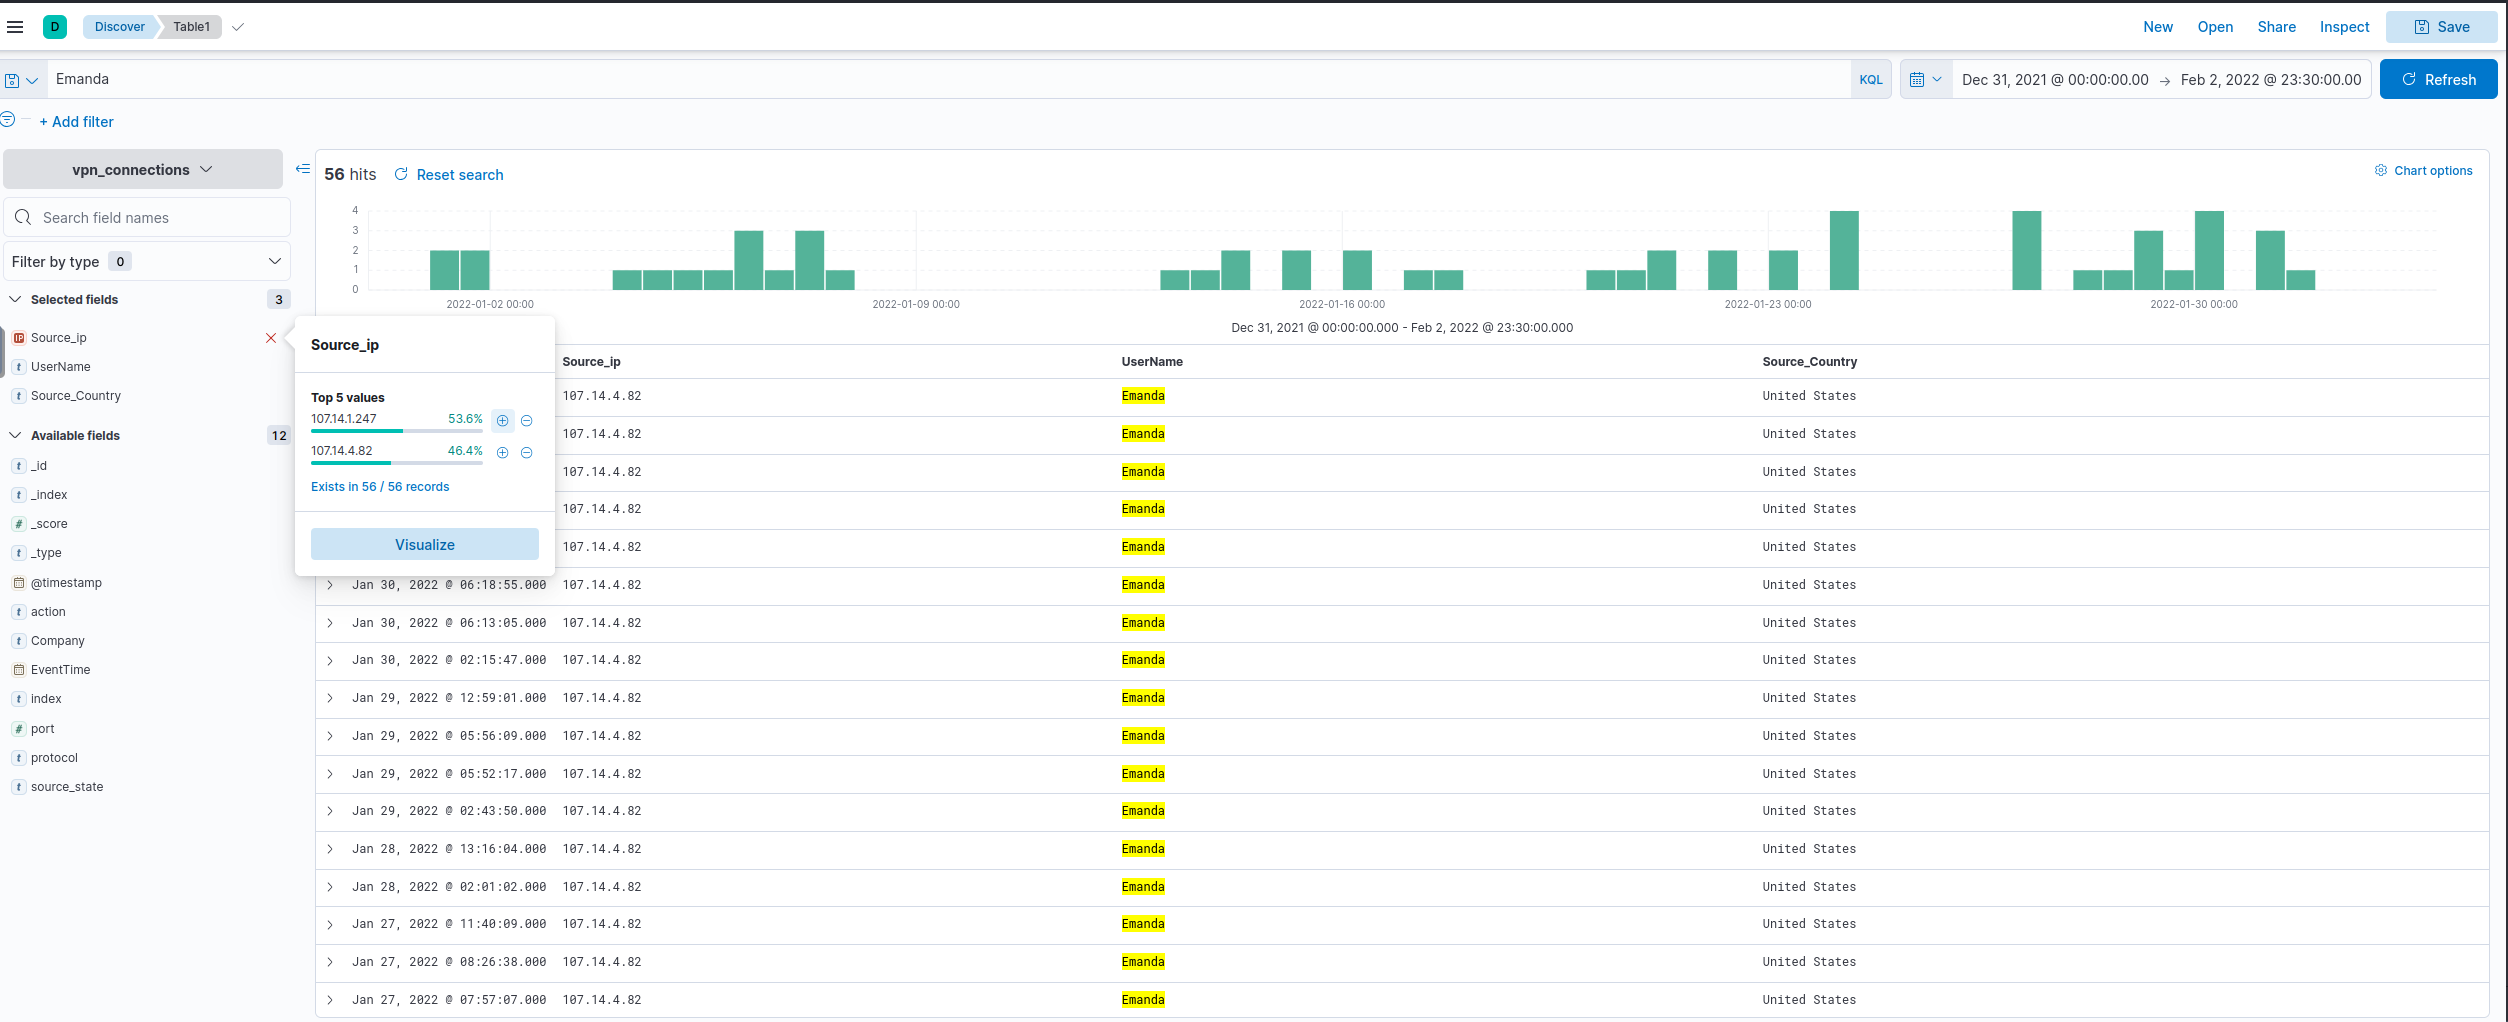
Select the index vpn_connections and filter from 31st December 2021 to 2nd Feb 2022. How many hits are returned?
Which IP address has the max number of connections?
Which user is responsible for max traffic?
Create a table with the fields IP, UserName, Source_Country and save.
Apply Filter on UserName Emanda; which SourceIP has max hits?
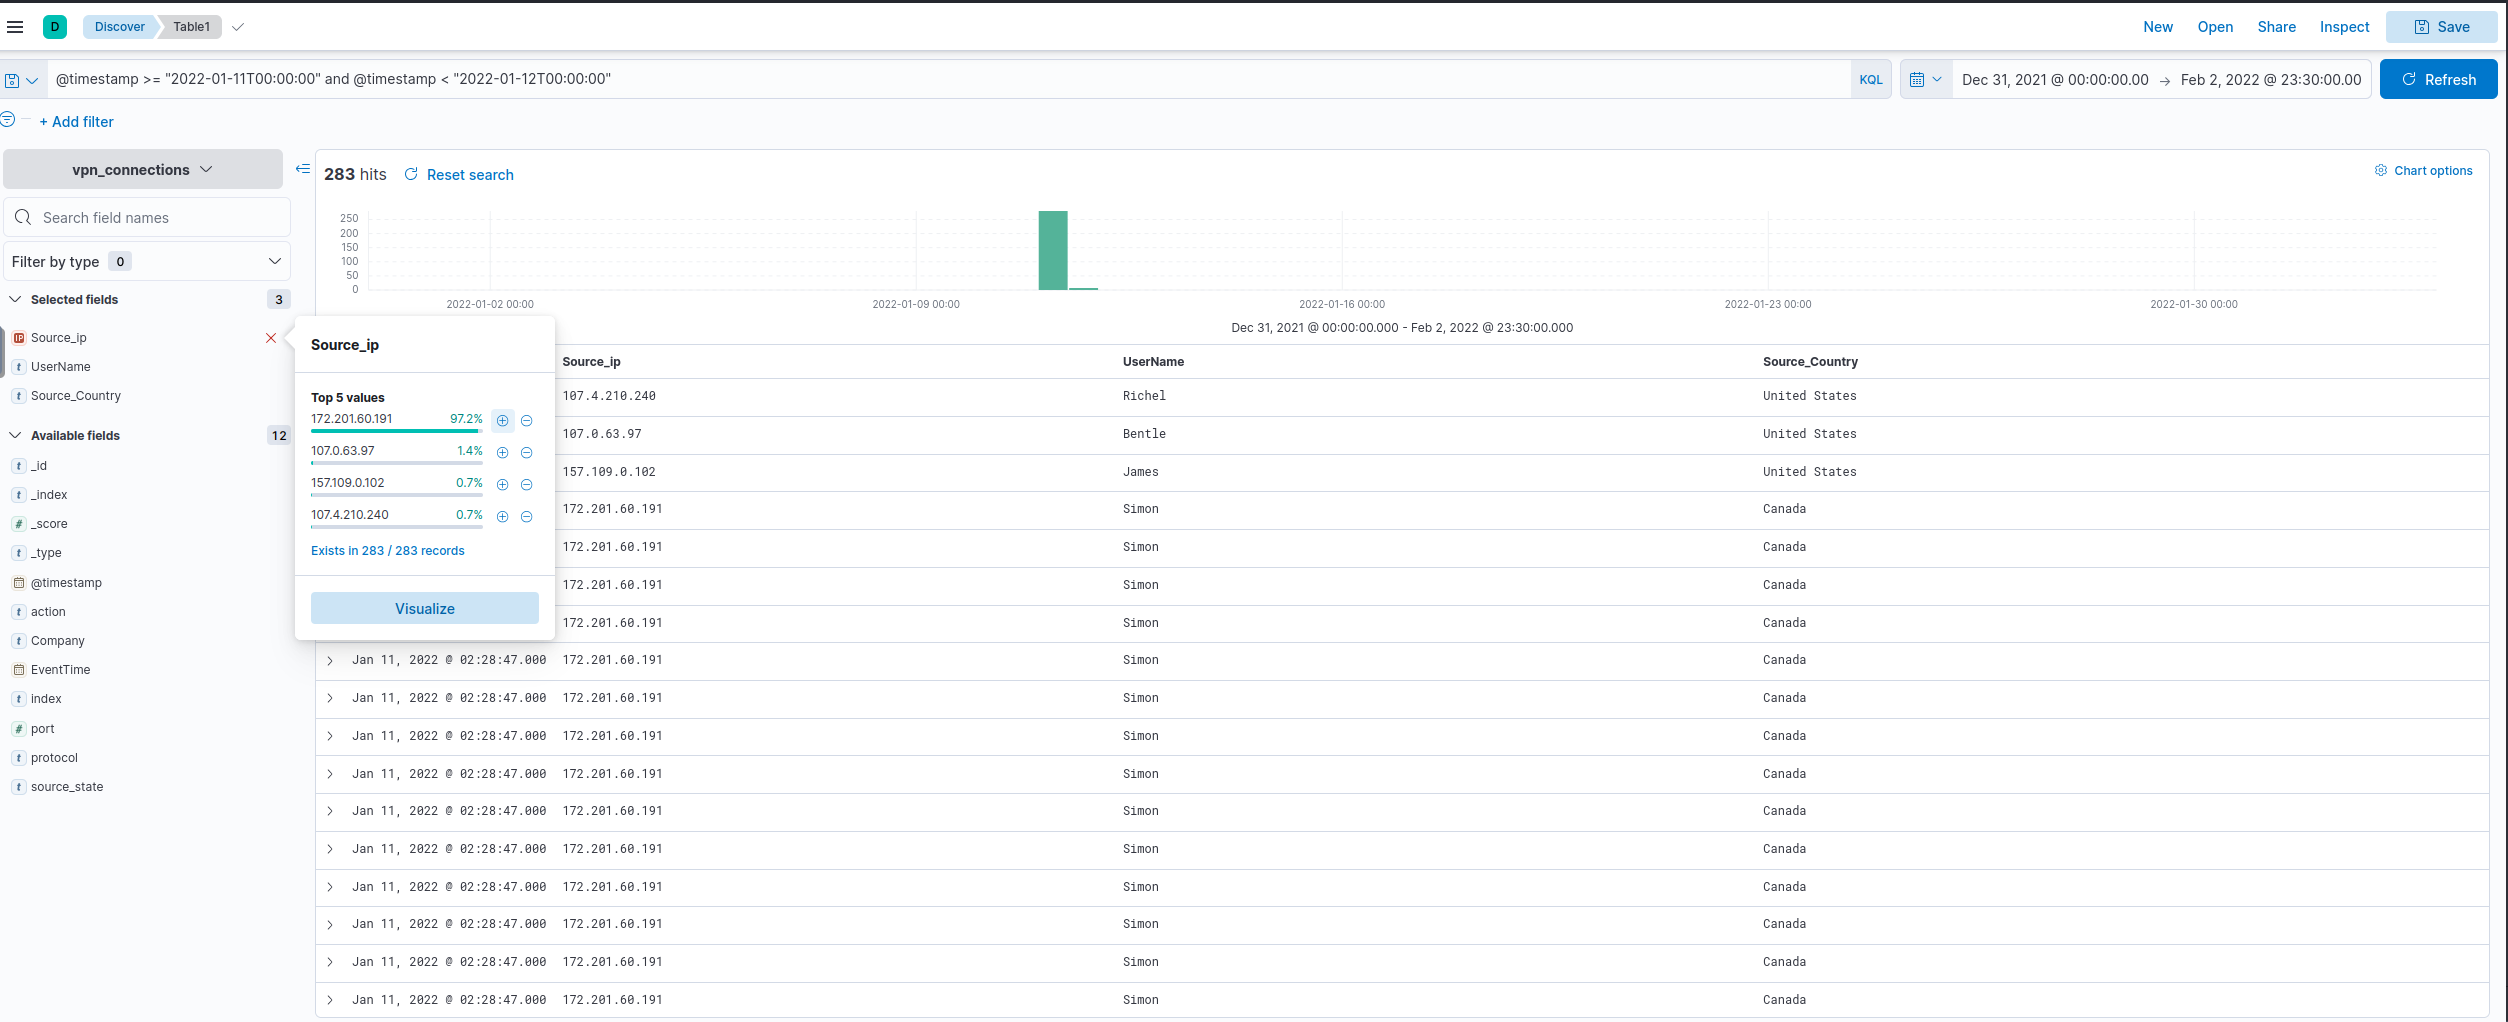
On 11th Jan, which IP caused the spike observed in the time chart?
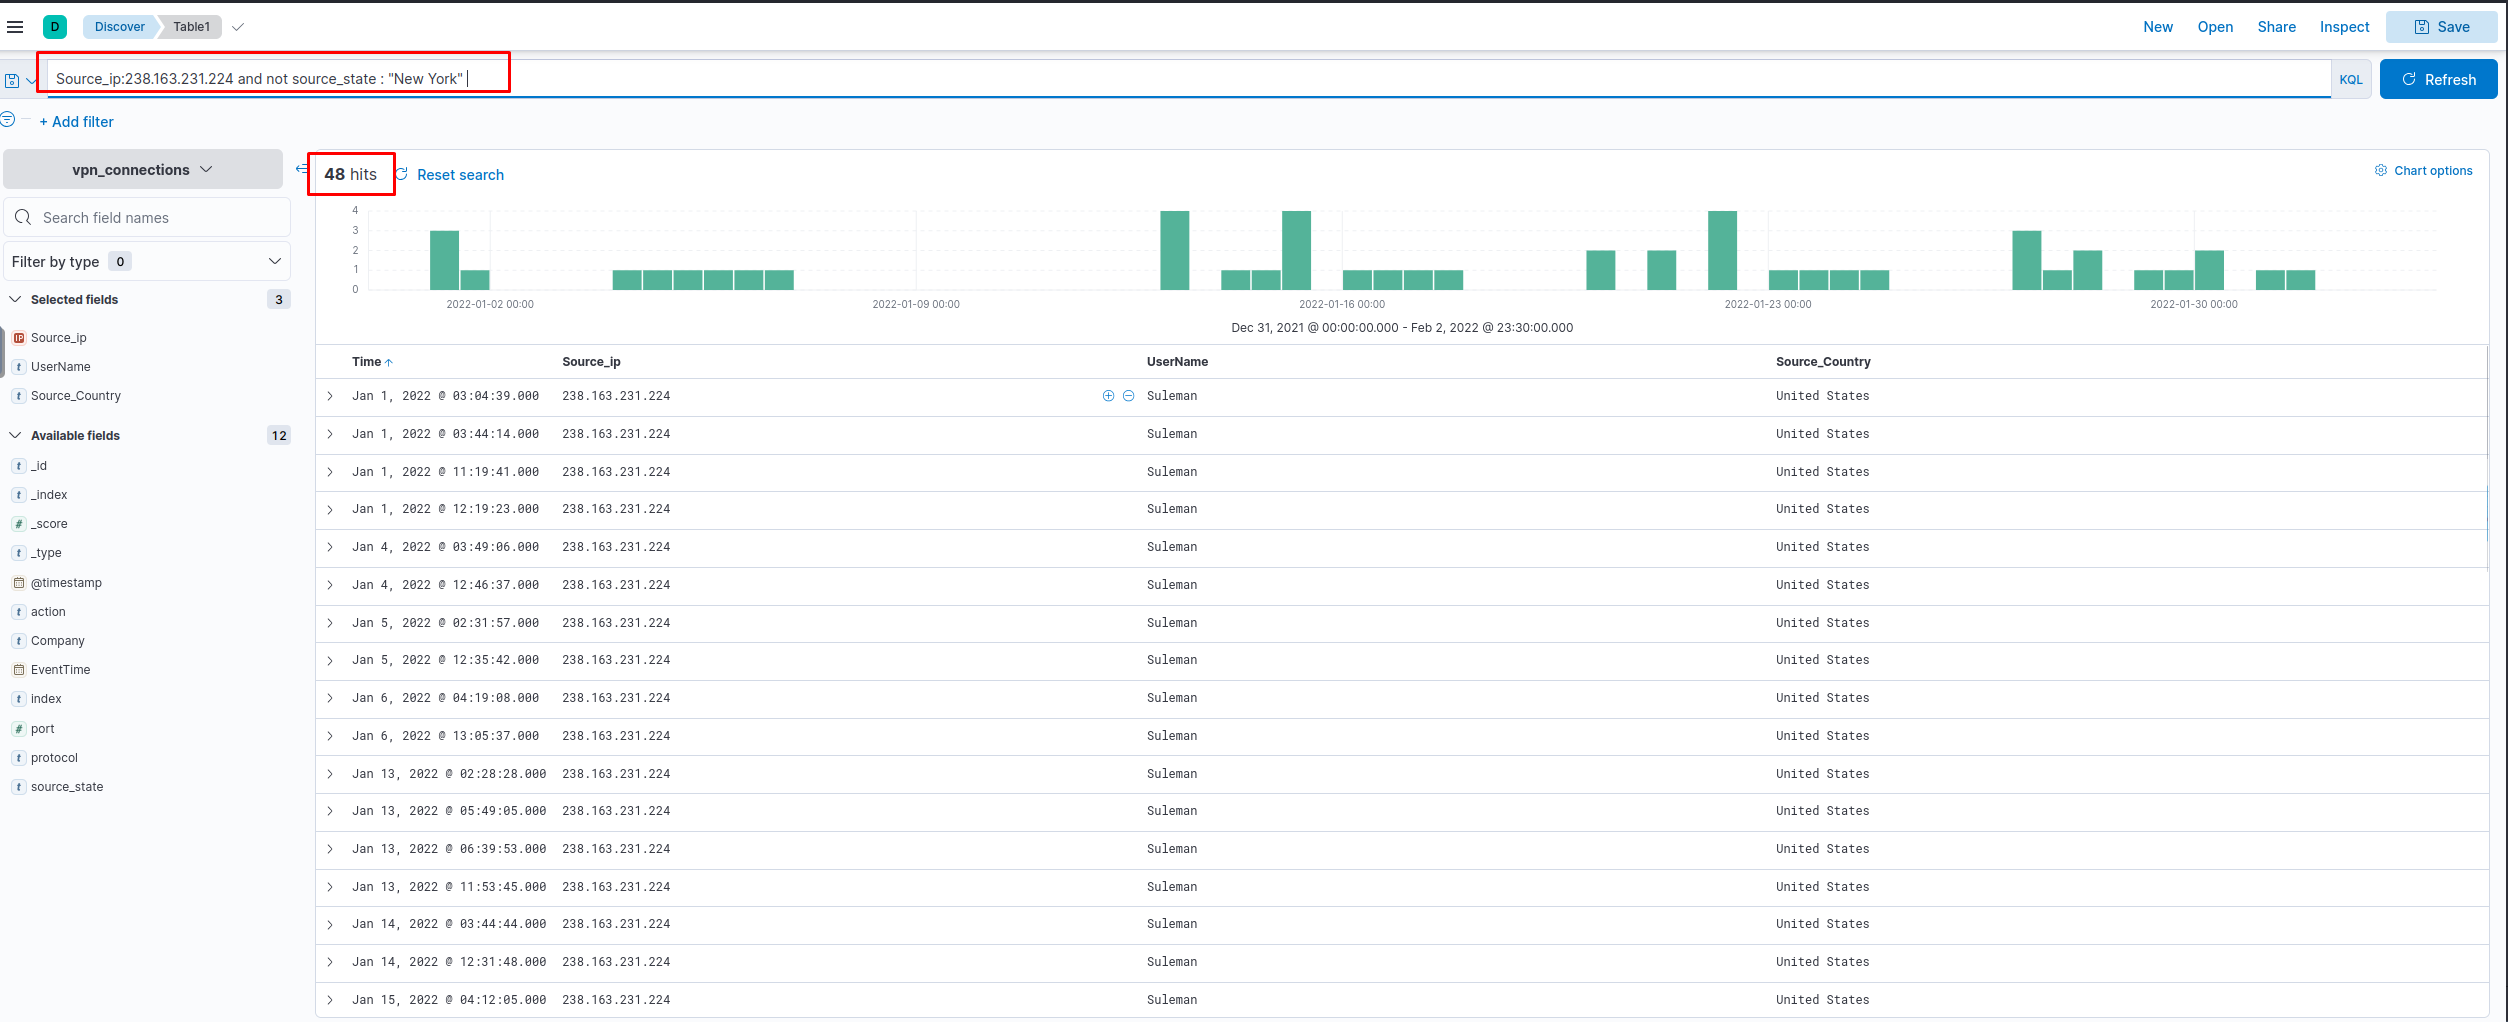
How many connections were observed from IP 238.163.231.224, excluding the New York state?
KQL Overview
KQL (Kibana Query Language) is a search query language used to search the ingested logs/documents in the elasticsearch. Apart from the KQL language, Kibana also supports Lucene Query Language.
In this task, we will be exploring KQL syntax. With KQL, we can search for the logs in two different ways.
- Free text search
- Field-based search
Free text Search
Free text search allows users to search for the logs based on the text-only. That means a simple search of the term security will return all the documents that contain this term, irrespective of the field.
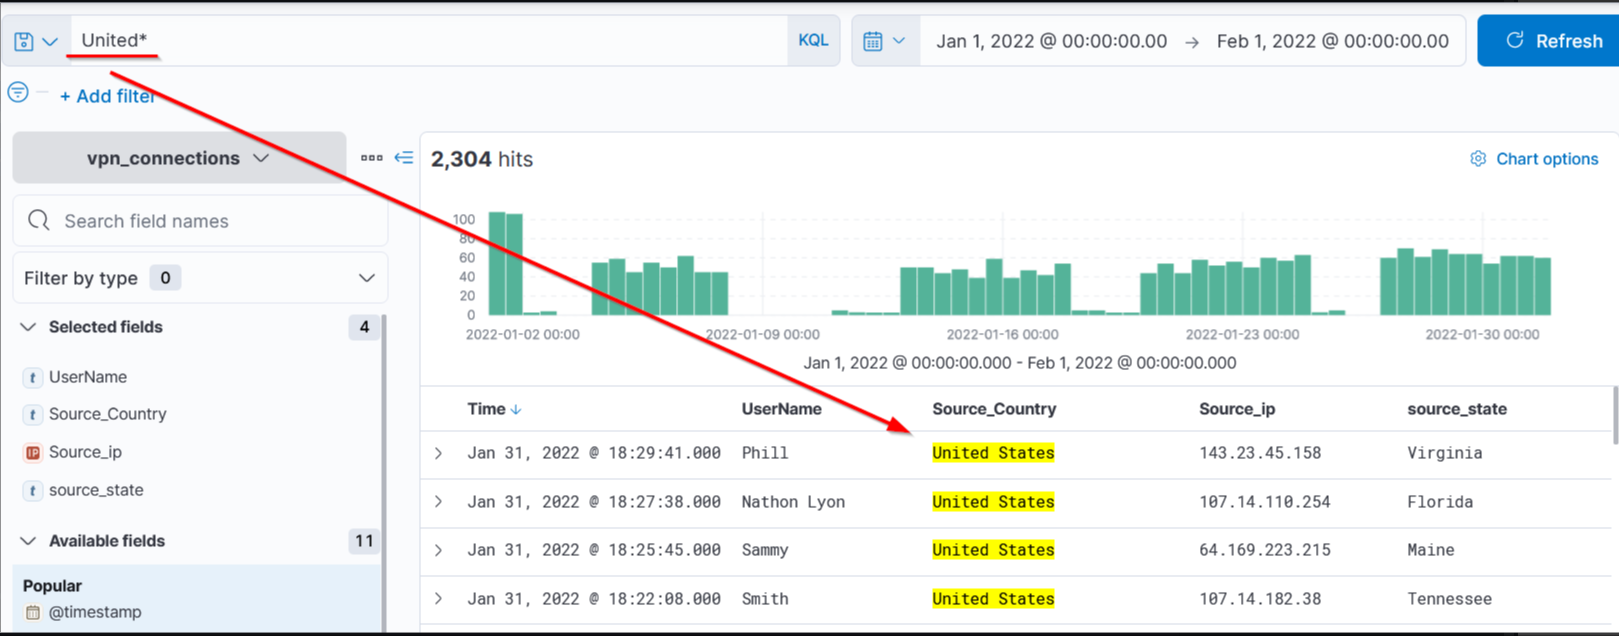
WILD CARD
KQL allows the wild card * to match parts of the term/word. Let’s find out how to use this wild card in the search query.
Search Query: United*
Logical Operators (AND | OR | NOT)
KQL also allows users to utilize the logical operators in the search query.
Field-based search
In the Field-based search, we will provide the field name and the value we are looking for in the logs. This search has a special syntax as FIELD : VALUE. It uses a colon : as a separator between the field and the value.
As we click on the search bar, we will be presented with all the available fields that we can use in our search query. To explore the other options of KQL, look at this official reference https://www.elastic.co/guide/en/kibana/7.17/kuery-query.html
Challenge
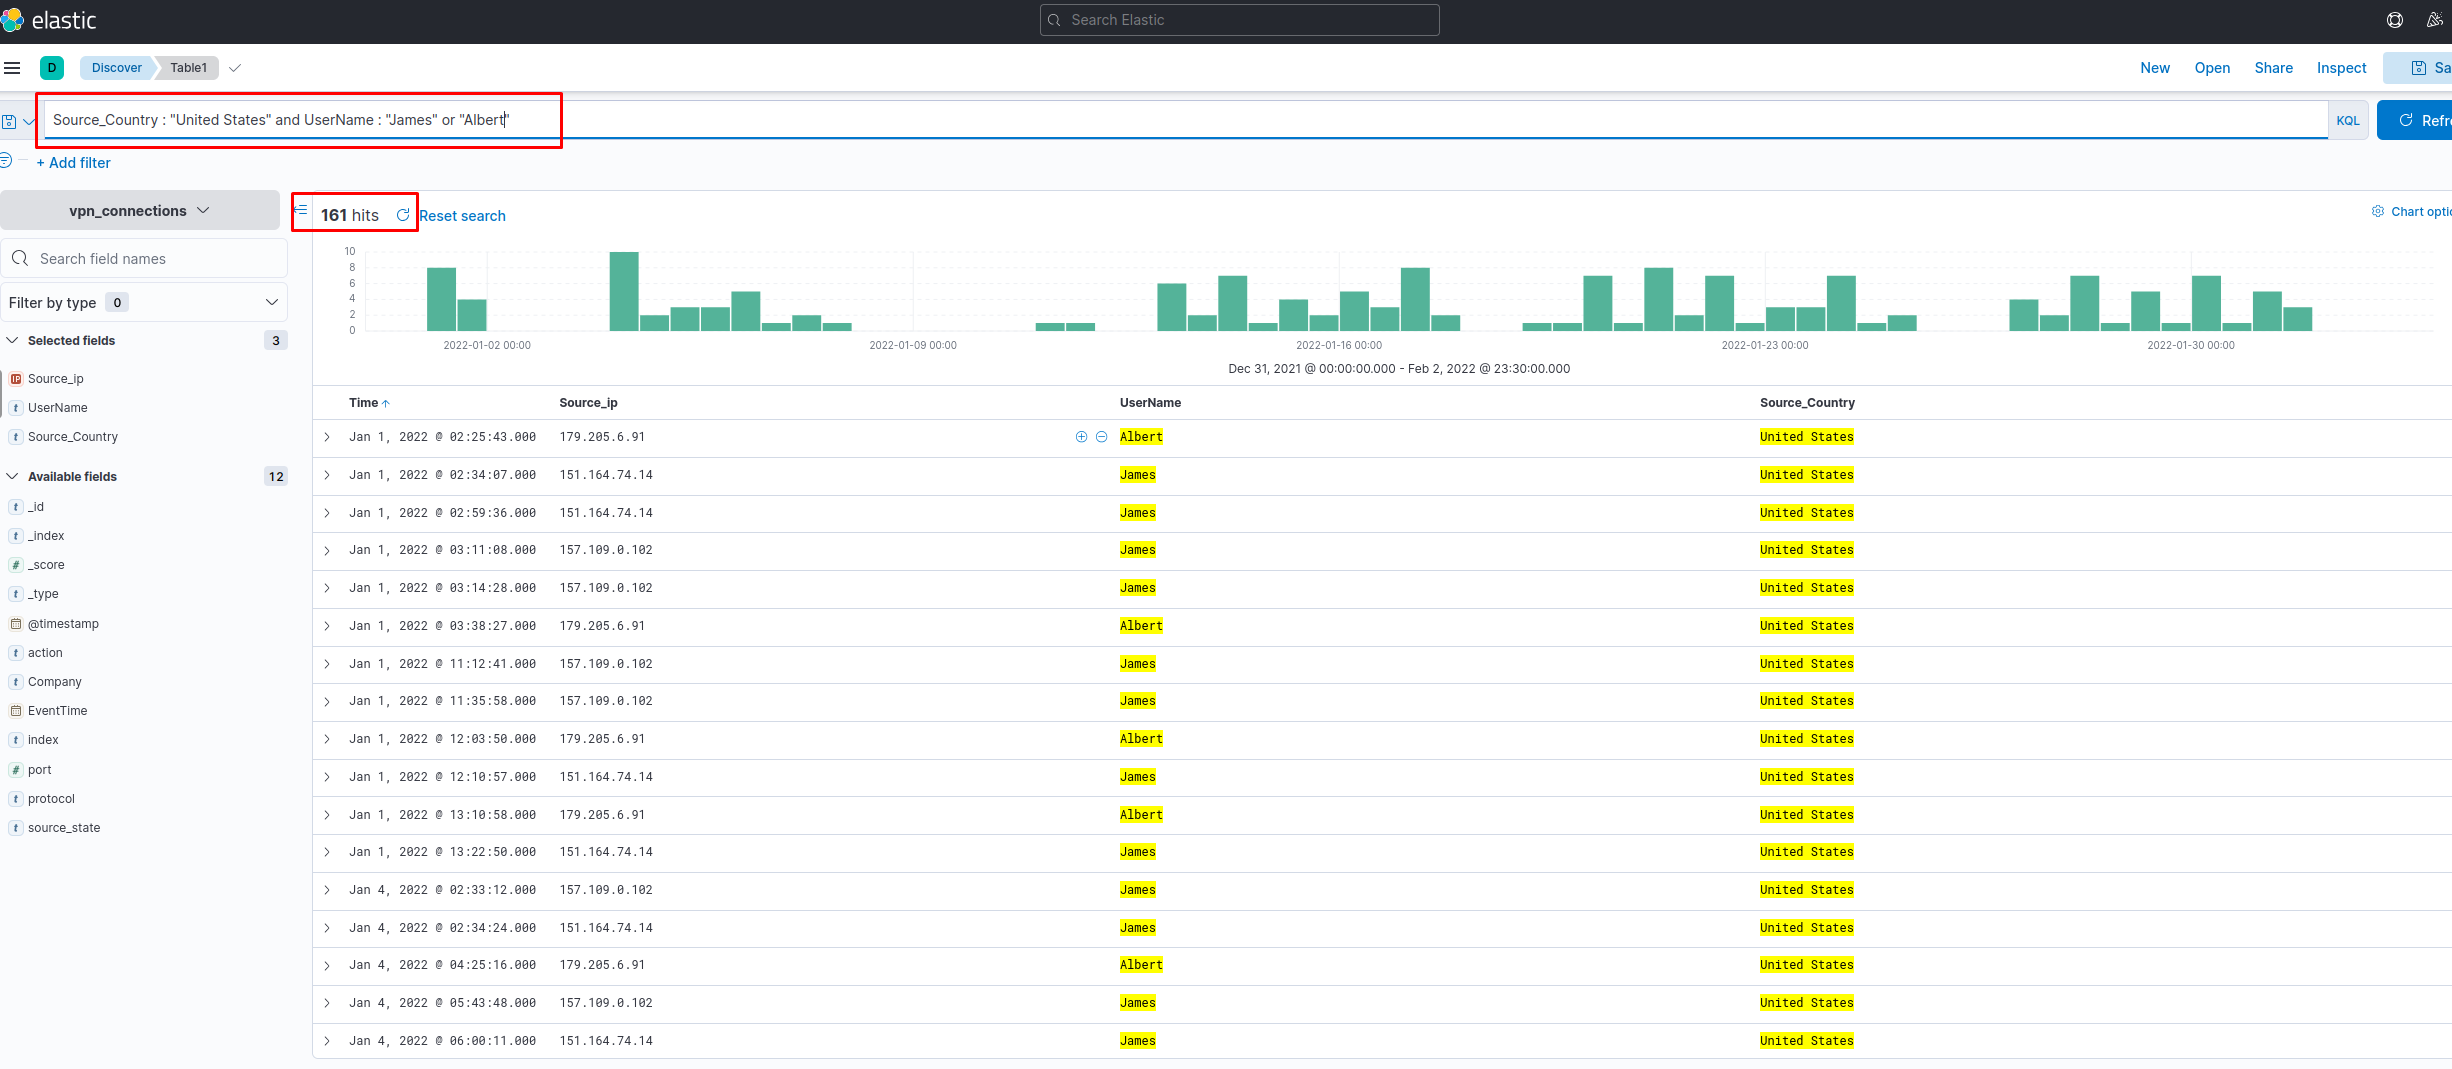
Create a search query to filter out the logs from Source_Country as the United States and show logs from User James or Albert. How many records were returned?
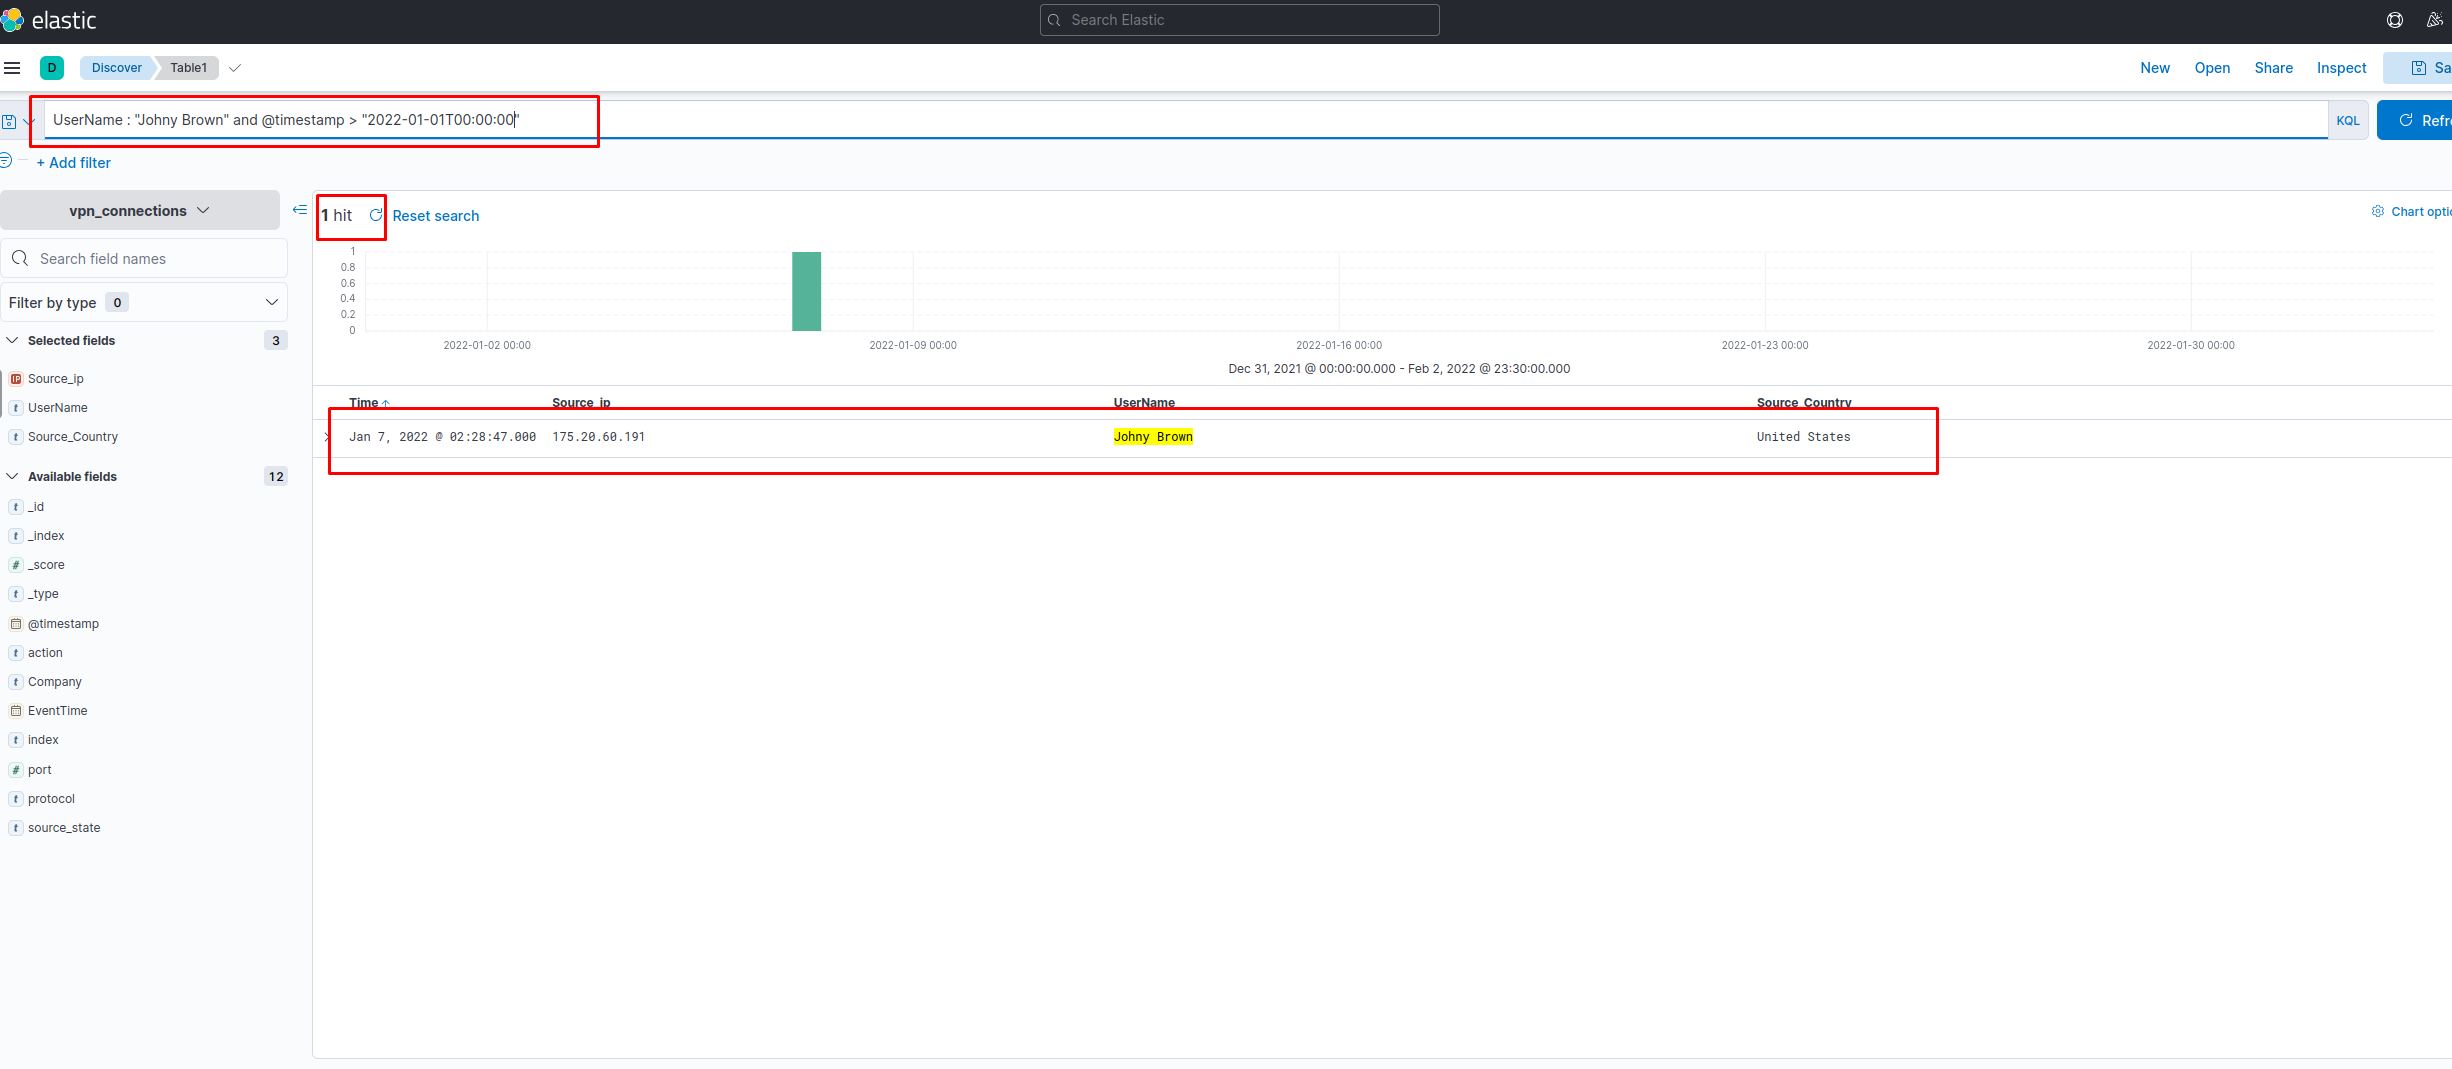
As User Johny Brown was terminated on 1st January 2022, create a search query to determine how many times a VPN connection was observed after his termination.
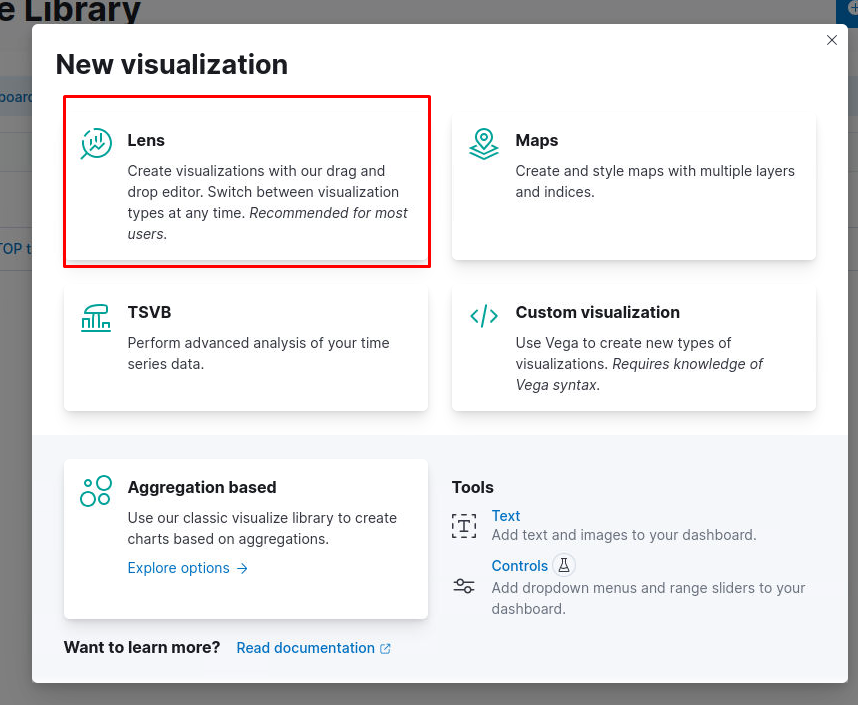
Create Visualization
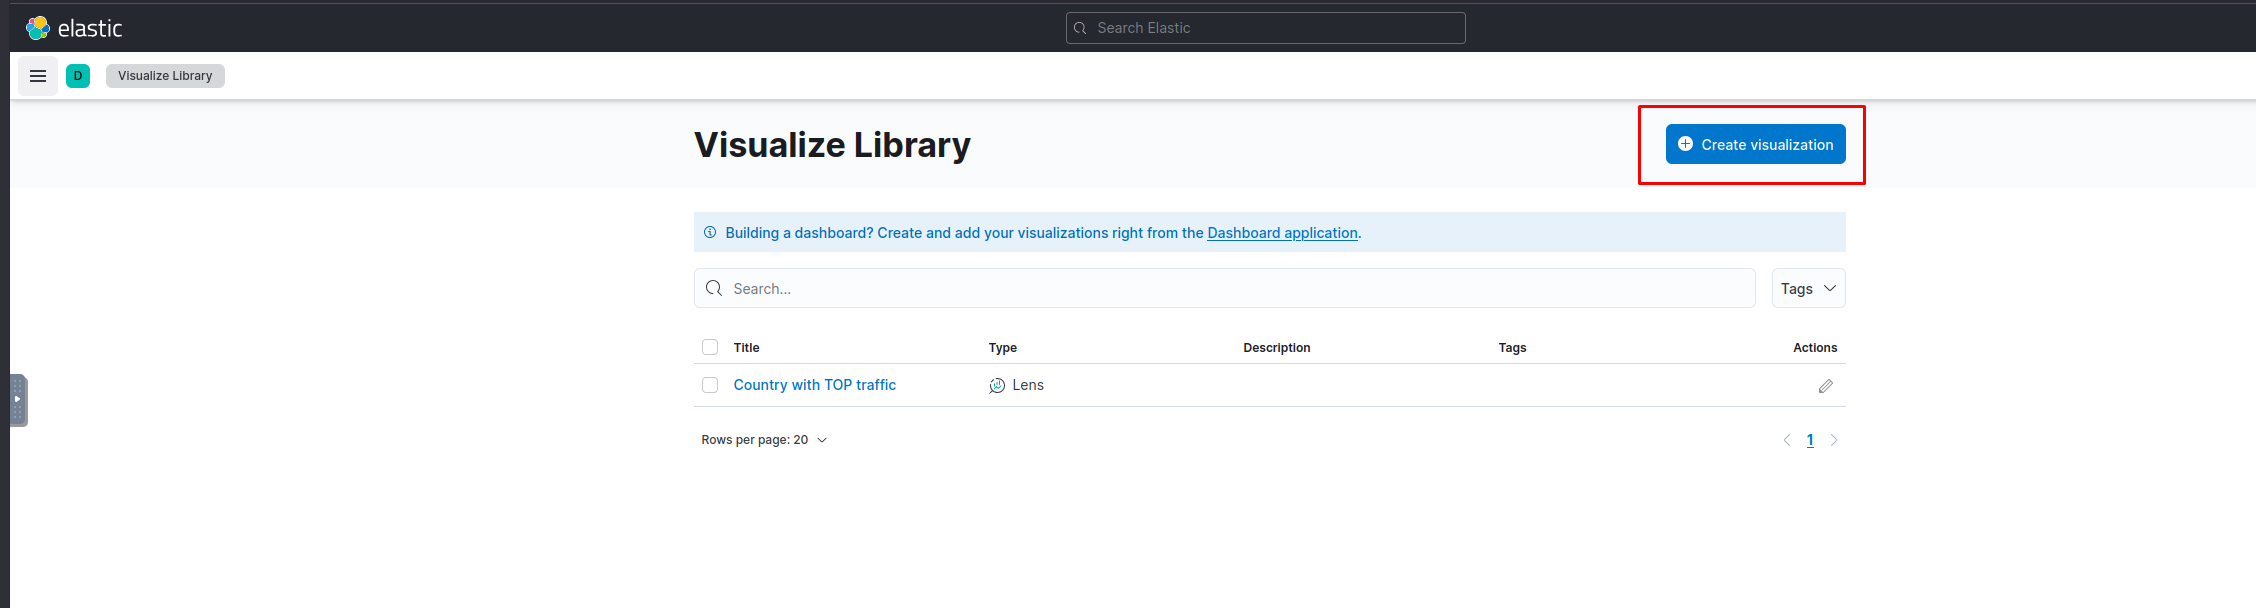
The visualization tab allows us to visualize the data in different forms like Table, Pie charts, Bar charts, etc. This visualization task will use multiple options this tab provides to create some simple presentable visualizations.
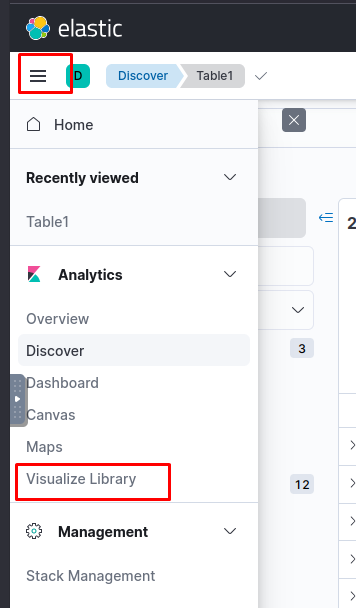
There are a few ways to navigate to the visualization tab. One way is to click on any field in the discover tab and click on the visualization
We can create multiple visualizations by selecting options like tables, pie charts, etc.
Correlation Option
Often, we require creating correlations between multiple fields. Dragging the required field in the middle will create a correlation tab in the visualization tab. Here we selected the Source_Country as the second field to show a correlation among the client Source_IP.
We can also create a table to show the values of the selected fields as columns
The most important step in creating these visualizations is to save them. Click on the save Option on the right side and fill in the descriptive values below. We can add these visualizations to the already existing dashboard, or we can create a new one as well.
Steps to take after creating Visualizations:
- Create a visualization and Click on the Save button at the top right corner.
- Add the title and description to the visualization.
- We can add the visualization to any existing Dashboard or a new dashboard.
- Click Save and add to the library when it’s done.
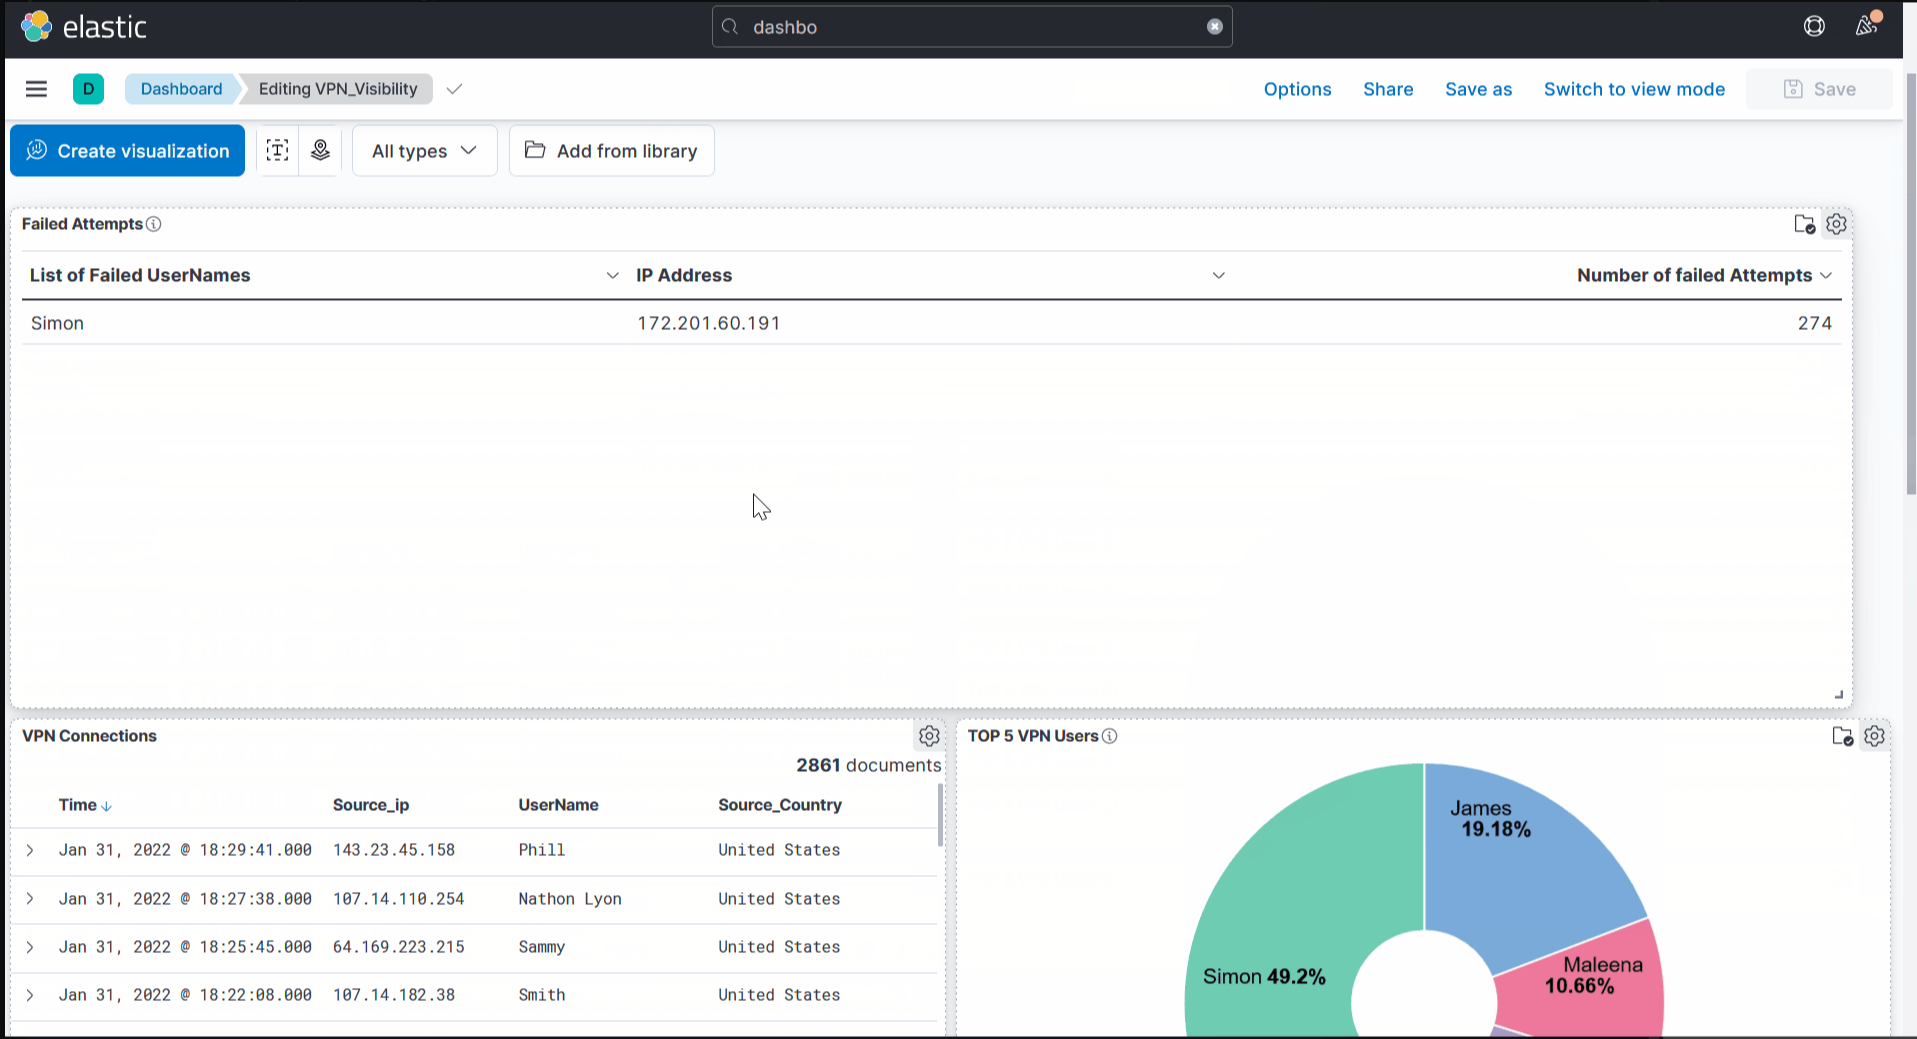
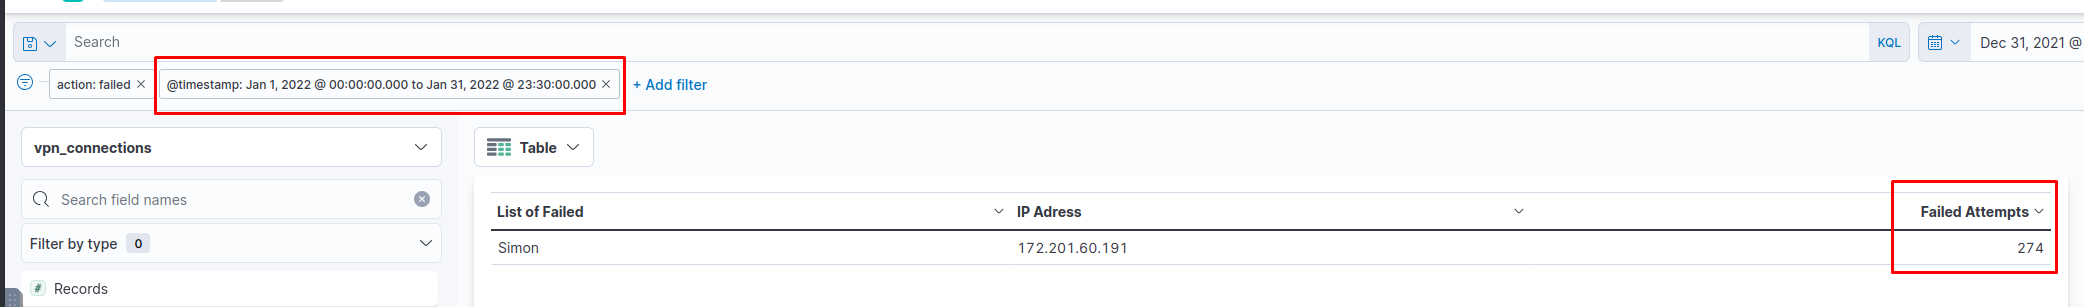
Failed Connection Attempts
We will utilize the knowledge gained above to create a table to display the user and the IP address involved in failed attempts.
Which user was observed with the greatest number of failed attempts?
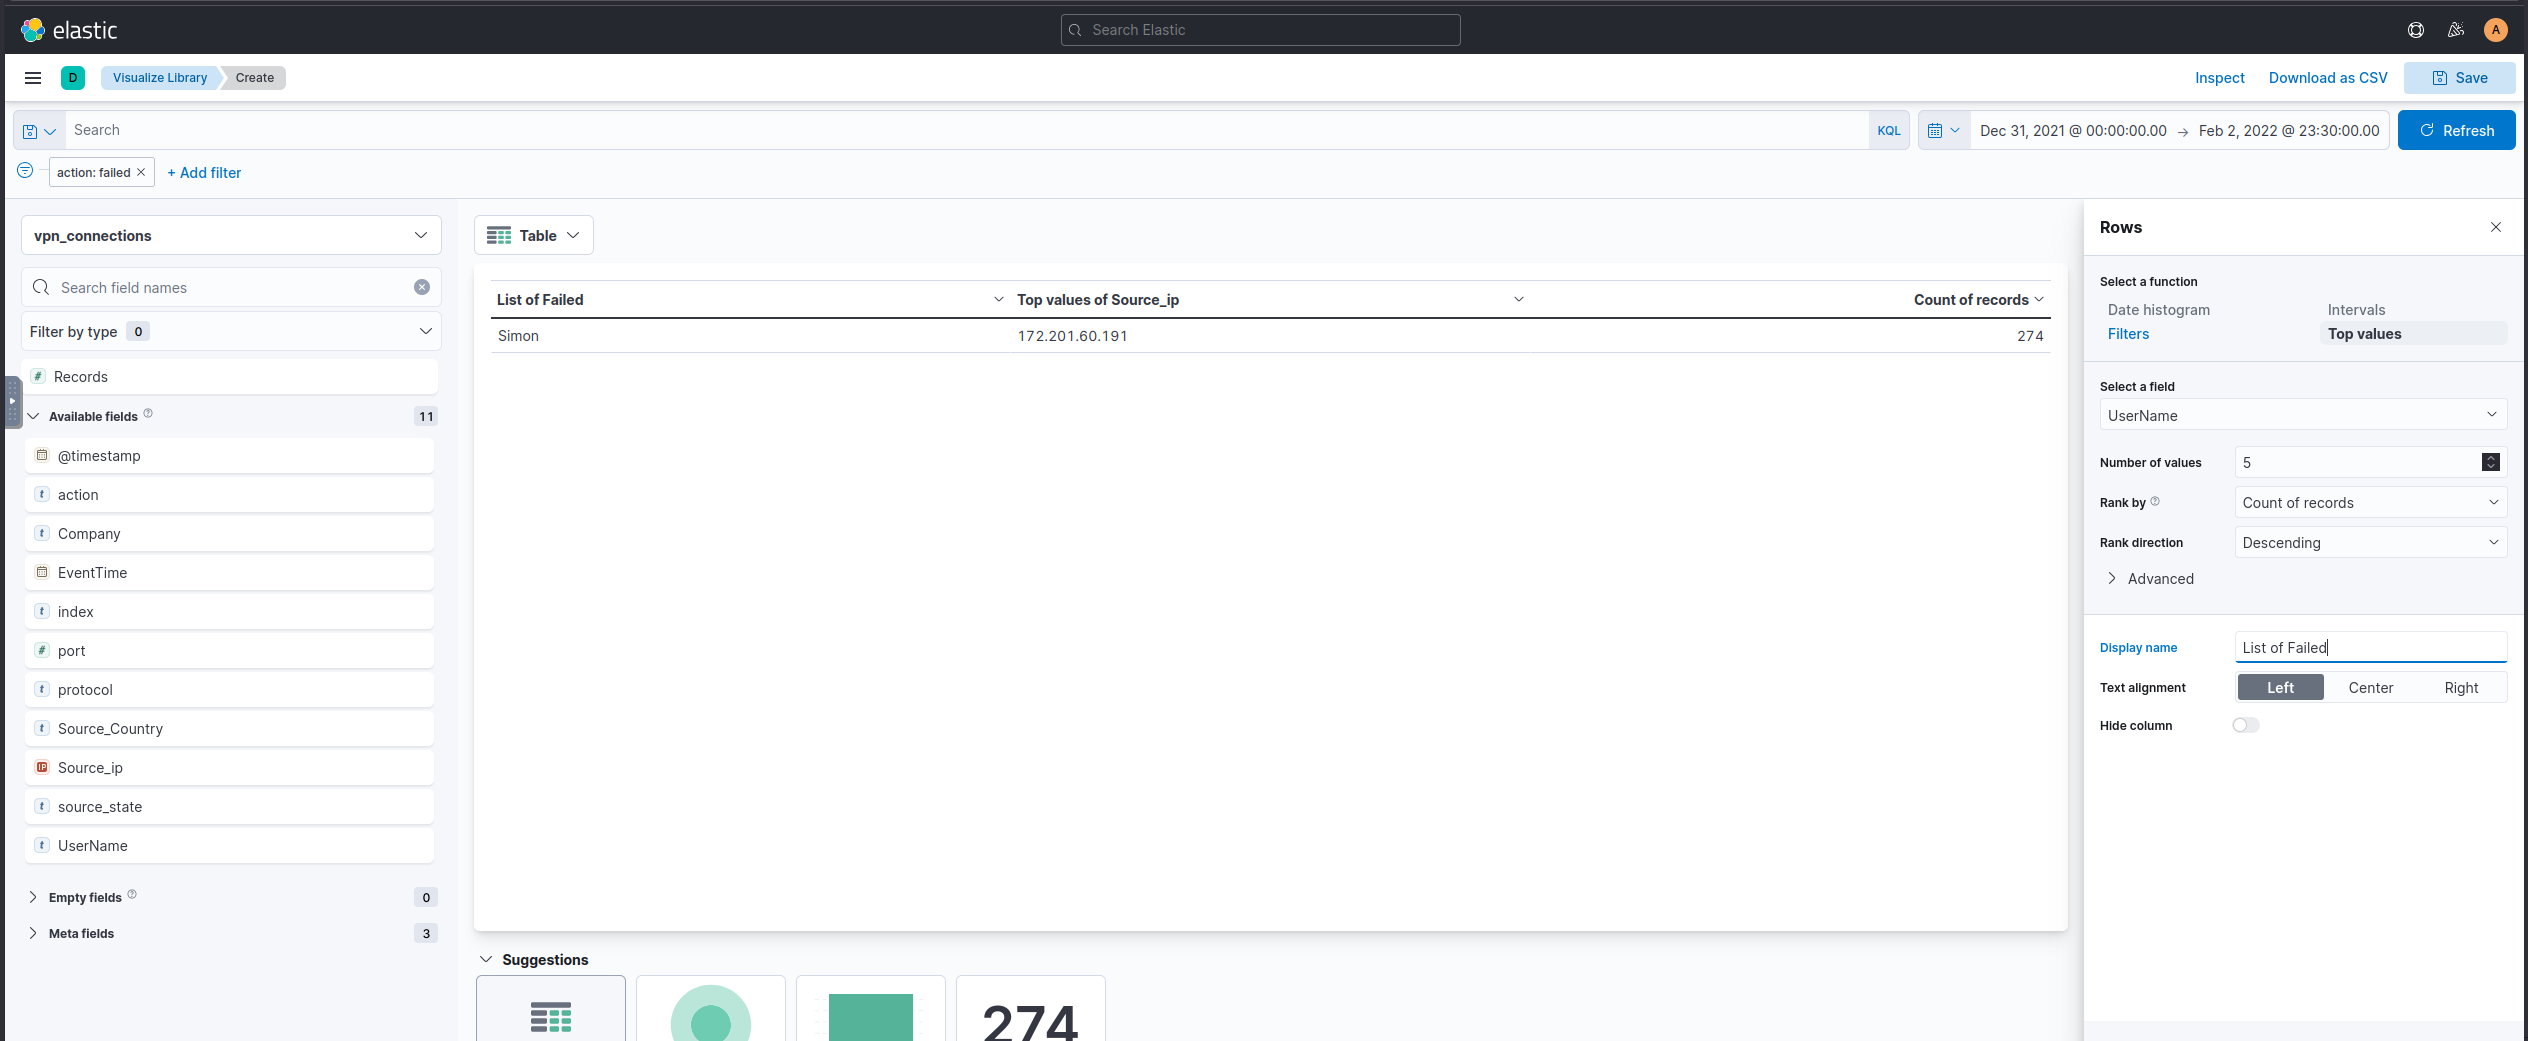
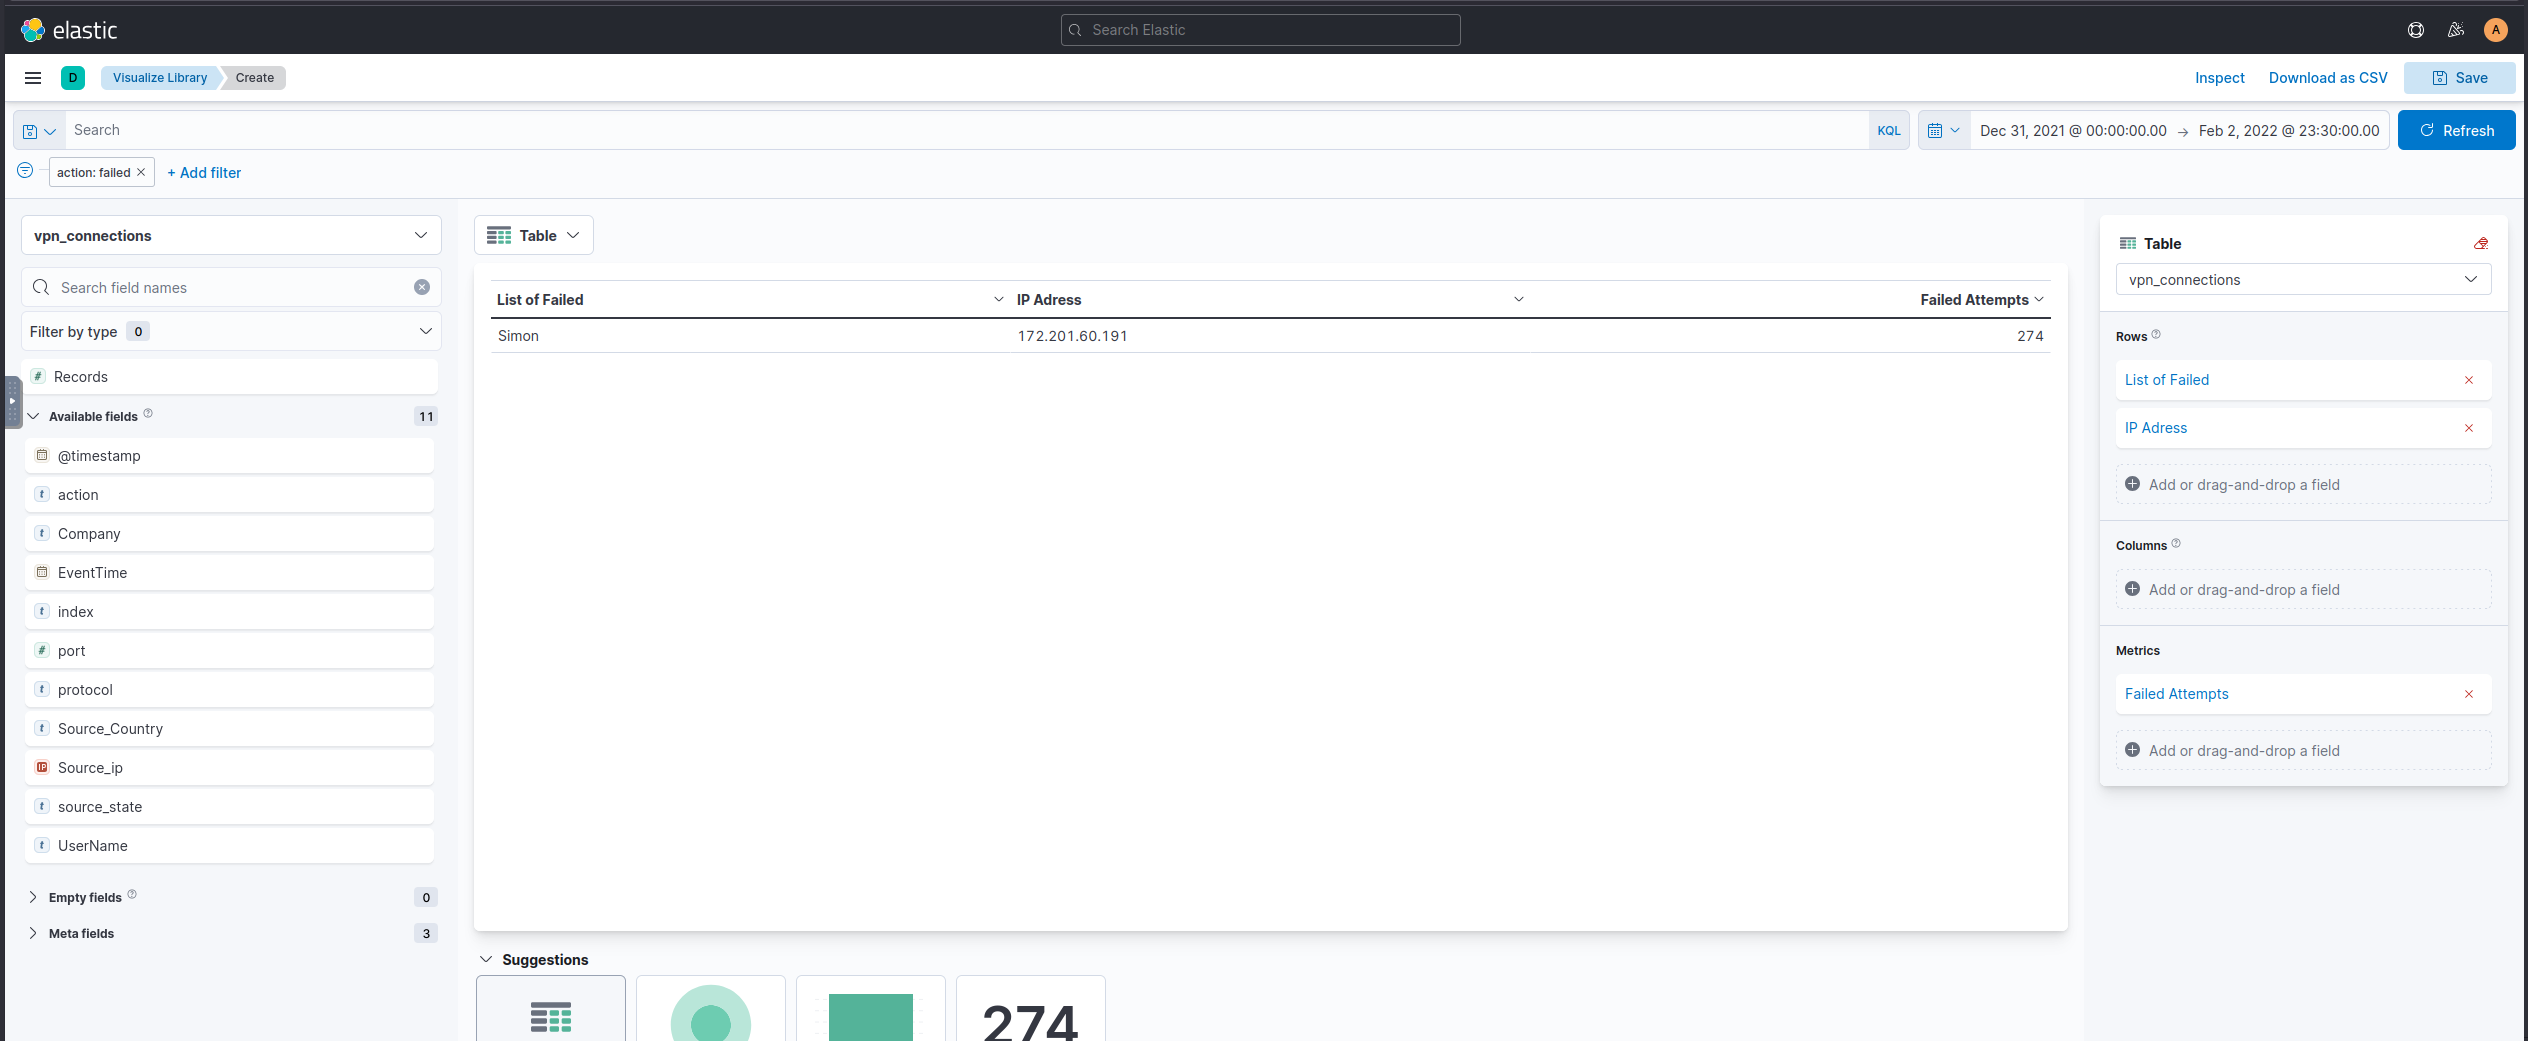
Simon
How many wrong VPN connection attempts were observed in January?
Creating Dashboards
Dashboards provide good visibility on the logs collection. A user can create multiple dashboards to fulfil a specific need.
In this task, we can combine different saved searches and visualizations to create a custom dashboard for VPN logs visibility.
Creating Custom Dashboard
By now, we have saved a few searches from the Discover tab and created some visualizations, and saved them. It’s time to explore the dashboard tab and create a custom dashboard. The steps to create a dashboard are:
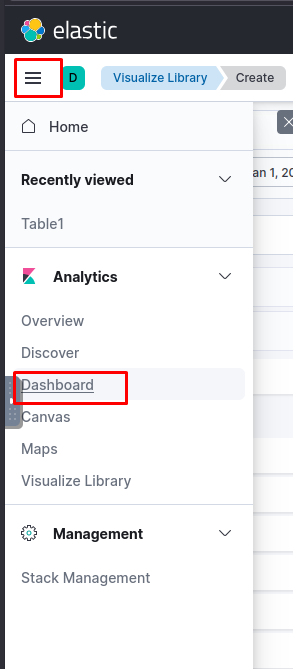
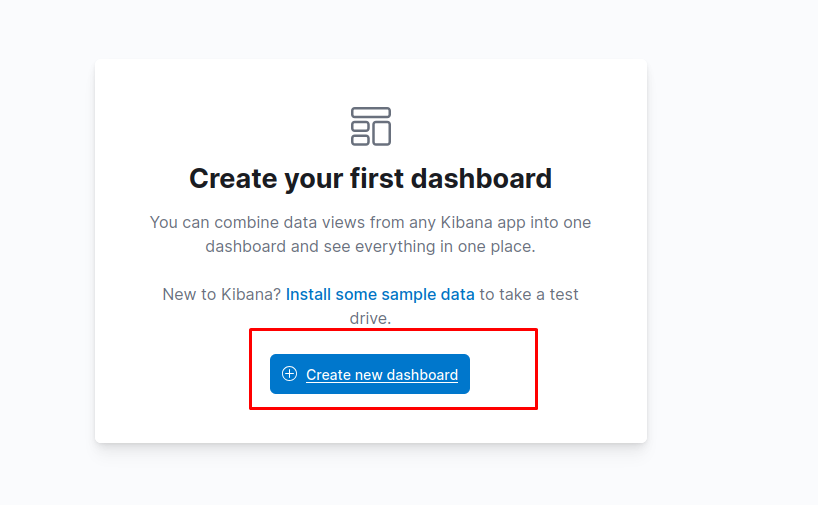
Go to the Dashboard tab and click on the Create dashboard.
- Click on Add from Library.
- Click on the visualizations and saved searches. It will be added to the dashboard.
- Once the items are added, adjust them accordingly, as shown below.
- Don’t forget to save the dashboard after completing it.